在浏览器中可视化优化后的云GeoTIFF


项目描述
rio-viz
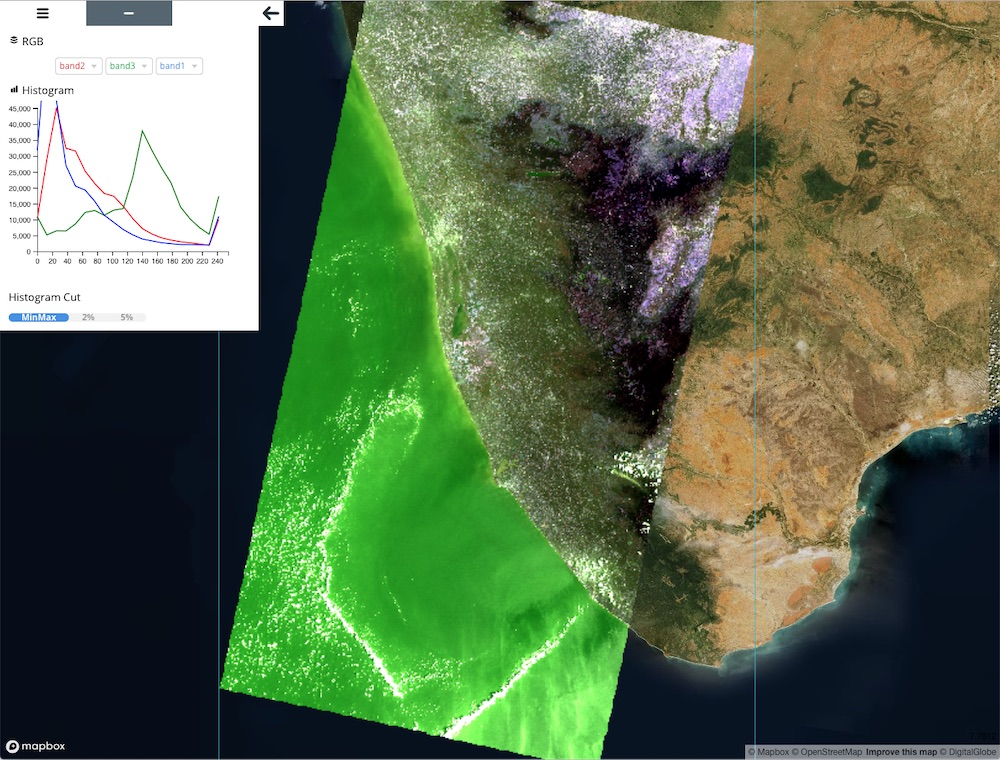
A Rasterio插件,用于在浏览器中可视化优化后的云GeoTIFF。


安装
您可以使用pip安装rio-viz
$ pip install rio-viz
带有3d功能
# 3d visualization features is optional
$ pip install -U pip
$ pip install rio-viz["mvt"]
从源代码构建
$ git clone https://github.com/developmentseed/rio-viz.git
$ cd rio-viz
$ pip install -e .
CLI
$ rio viz --help
Usage: rio viz [OPTIONS] SRC_PATH

  Rasterio Viz cli.

Options:
  --nodata NUMBER|nan  Set nodata masking values for input dataset.
  --minzoom INTEGER    Overwrite minzoom
  --maxzoom INTEGER    Overwrite maxzoom
  --port INTEGER       Webserver port (default: 8080)
  --host TEXT          Webserver host url (default: 127.0.0.1)
  --no-check           Ignore COG validation
  --reader TEXT        rio-tiler Reader (BaseReader). Default is `rio_tiler.io.COGReader`
  --layers TEXT        limit to specific layers (only used for MultiBand and MultiBase Readers). (e.g --layers b1 --layers b2).
  --server-only        Launch API without opening the rio-viz web-page.
  --config NAME=VALUE  GDAL configuration options.
  --help               Show this message and exit.
多读取器支持
rio-viz支持多个/自定义读取器,只要它们是rio_tiler.io.base.BaseReader的子类即可。
# Multi Files as Bands
$ rio viz "cog_band{2,3,4}.tif" --reader rio_viz.io.MultiFilesBandsReader

# Simple Mosaic
$ rio viz "tests/fixtures/mosaic_cog{1,2}.tif" --reader rio_viz.io.MosaicReader

# MultiBandReader
# Landsat 8 - rio-tiler-pds
# We use `--layers` to limit the number of bands
$ rio viz LC08_L1TP_013031_20130930_20170308_01_T1 \
  --reader rio_tiler_pds.landsat.aws.landsat8.L8Reader \
  --layers B1,B2 \
  --config GDAL_DISABLE_READDIR_ON_OPEN=FALSE \
  --config CPL_VSIL_CURL_ALLOWED_EXTENSIONS=".TIF,.ovr"

# MultiBaseReader
# We use `--layers` to limit the number of assets
rio viz https://earth-search.aws.element84.com/v0/collections/sentinel-s2-l2a-cogs/items/S2A_34SGA_20200318_0_L2A \
  --reader rio_tiler.io.STACReader \
  --layers B04,B03,B02
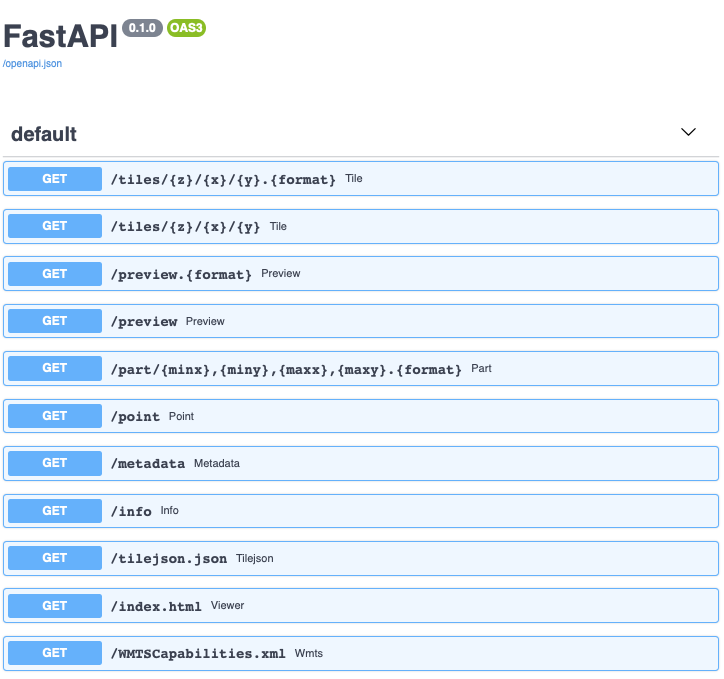
RestAPI
当启动rio-viz时,应用程序将创建一个FastAPI应用程序,以访问和读取您想要的数据。默认情况下,CLI将为您打开一个网页以探索文件,但您可以使用--server-only选项来忽略此操作。
$ rio viz my.tif --server-only

# In another console
$ curl http://127.0.0.1:8080/info | jq
{
  "bounds": [6.608576517072109, 51.270642883468895, 11.649386808679436, 53.89267160832534],
  "band_metadata": [...],
  "band_descriptions": [...],
  "dtype": "uint8",
  "nodata_type": "Mask",
  "colorinterp": [
    "red",
    "green",
    "blue"
  ]
}
您可以在http://127.0.0.1:8080/docs上查看完整的API文档
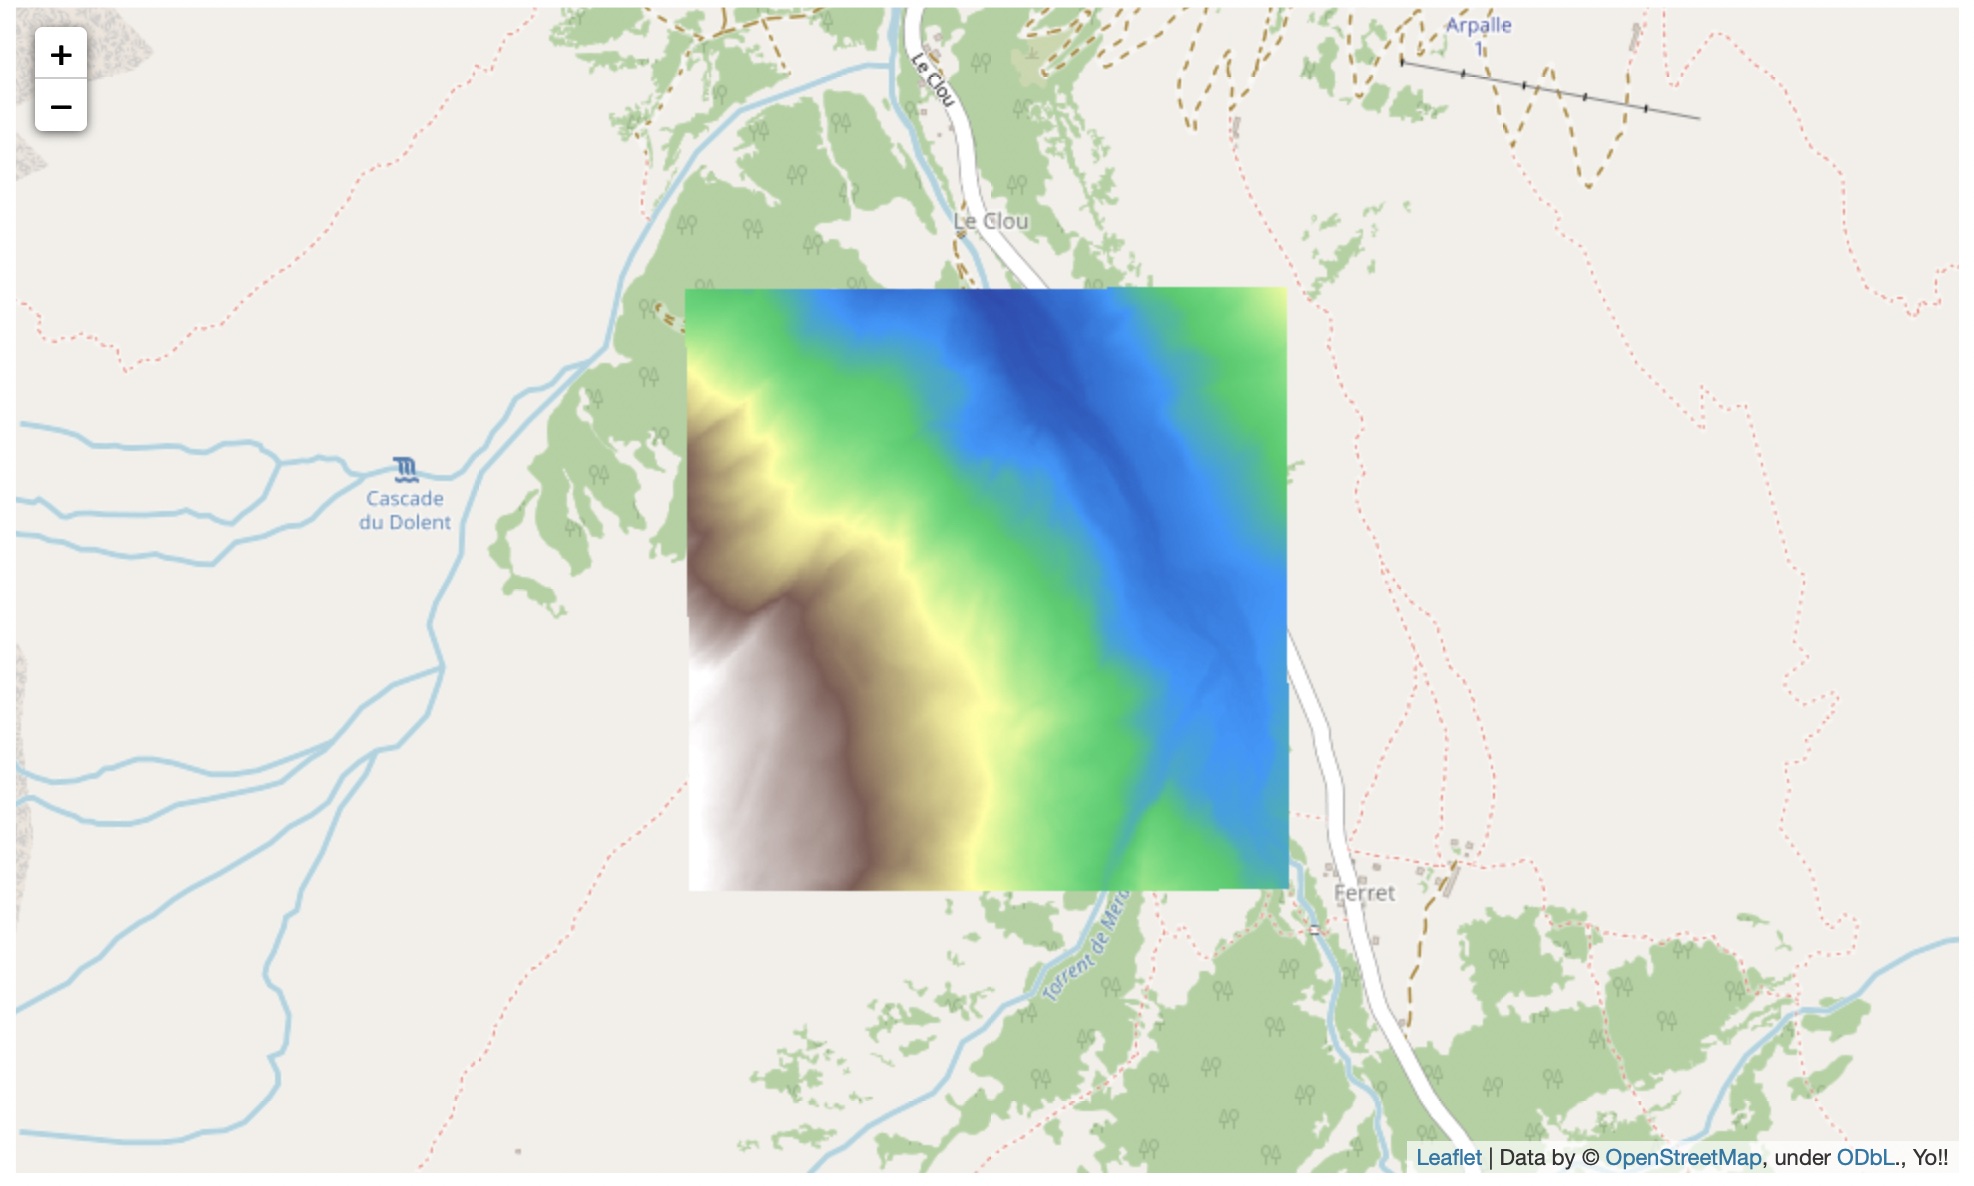
在笔记本环境中
感谢server-thread的出色之处,我们可以在笔记本环境中使用rio-viz应用程序。
import time

import httpx
from folium import Map, TileLayer

from rio_viz.app import Client

# Create rio-viz Client (using server-thread to launch backgroud task)
client = Client("https://data.geo.admin.ch/ch.swisstopo.swissalti3d/swissalti3d_2019_2573-1085/swissalti3d_2019_2573-1085_0.5_2056_5728.tif")

# Gives some time for the server to setup
time.sleep(1)

r = httpx.get(
    f"{client.endpoint}/tilejson.json",
    params = {
        "rescale": "1600,2000",  # from the info endpoint
        "colormap_name": "terrain",
    }
).json()

bounds = r["bounds"]
m = Map(
    location=((bounds[1] + bounds[3]) / 2,(bounds[0] + bounds[2]) / 2),
    zoom_start=r["minzoom"]
)

aod_layer = TileLayer(
    tiles=r["tiles"][0],
    opacity=1,
    attr="Yo!!"
)
aod_layer.add_to(m)
m
3D(实验性)
rio-viz支持从栅格数组到Mapbox VectorTiles的编码。此功能被添加以可视化存储为栅格的稀疏数据,但也适用于密集数组。这是一个高度实验性的功能,可能在某些浏览器中渲染速度较慢,或者对于大栅格来说可能较慢。
docker
可用的docker镜像可在Github注册表中找到。
docker run \
  --volume "$PWD":/data \
  --platform linux/amd64 \
  --rm -it -p 8080:8080 ghcr.io/developmentseed/rio-viz:latest \
  rio viz --host 0.0.0.0 /data/your-file.tif
注意事项
--platform linux/amd64仅在您使用最新的MacOS M1机器时需要。--volume "$PWD":/data用于将您的本地目录挂载到docker镜像中。- 要访问web服务器,rio-viz的选项
--host 0.0.0.0是必需的。
贡献与发展
作者
变更记录
请参阅CHANGES.md。
许可
请参阅LICENSE.txt


下载文件
下载您平台的文件。如果您不确定选择哪个,请了解更多关于安装包的信息。
源代码分发
rio_viz-0.12.2.tar.gz (38.7 kB 查看哈希值)
构建分发
rio_viz-0.12.2-py3-none-any.whl (44.2 kB 查看哈希值)


