Vega-Altair:Python的声明性统计可视化库。


项目描述
Vega-Altair 


Vega-Altair 是一个用于 Python 的声明式统计可视化库。使用 Vega-Altair,您可以花费更多时间理解数据和其含义。Vega-Altair 的 API 简单、友好且一致,建立在强大的 Vega-Lite JSON 规范之上。这种优雅的简单性用最少的代码产生美丽而有效的可视化。
Vega-Altair 由 Jake Vanderplas 和 Brian Granger 开发,并与 UW Interactive Data Lab 亲密合作。 VEGA-Altair 开源项目与 Altair Engineering, Inc. 无关。
文档
请参阅 Vega-Altair 的文档网站 以及 教程笔记本。您可以通过点击以下徽章之一在浏览器中直接运行笔记本:


示例
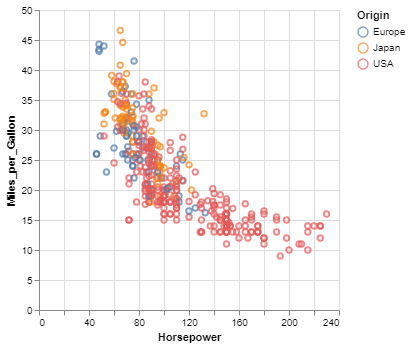
以下是一个示例,使用 Vega-Altair 在 JupyterLab 中快速可视化和显示数据集,使用原生的 Vega-Lite 渲染器。
import altair as alt

# load a simple dataset as a pandas DataFrame
from vega_datasets import data
cars = data.cars()

alt.Chart(cars).mark_point().encode(
    x='Horsepower',
    y='Miles_per_Gallon',
    color='Origin',
)
Vega-Altair 的一个独特功能,继承自 Vega-Lite,是除了可视化之外,还有 交互 的声明式语法。通过对上面的示例进行一些修改,我们可以创建一个基于散点图选择的筛选直方图的链接直方图。
import altair as alt
from vega_datasets import data

source = data.cars()

brush = alt.selection_interval()

points = alt.Chart(source).mark_point().encode(
    x='Horsepower',
    y='Miles_per_Gallon',
    color=alt.condition(brush, 'Origin', alt.value('lightgray'))
).add_params(
    brush
)

bars = alt.Chart(source).mark_bar().encode(
    y='Origin',
    color='Origin',
    x='count(Origin)'
).transform_filter(
    brush
)

points & bars
功能
- 精心设计的声明式 Python API。
- 自动生成的内部 Python API 确保可视化经过类型检查,并与 Vega-Lite 规范完全一致。
- 在 JupyterLab、Jupyter Notebook、Visual Studio Code、GitHub 和 nbviewer 以及许多其他地方显示可视化。
- 将可视化导出为各种格式,如 PNG/SVG 图像、独立的 HTML 页面和 在线 Vega-Lite 编辑器。
- 将可视化序列化为 JSON 文件。
安装
Vega-Altair 可以通过以下方式安装:
pip install altair
如果您使用 conda 包管理器,则等效命令是:
conda install altair -c conda-forge
有关完整的安装说明,请参阅 文档。
获取帮助
如果您在文档中找不到答案的问题,您可以在 StackOverflow 上使用 altair 标签发布。对于错误和功能请求,请打开 Github Issue。
开发


有关如何安装开发包的说明,请参阅 文档。
要运行测试和代码检查器,使用:
hatch test
有关如何将您的开发贡献回 Vega-Altair 存储库的信息,请参阅 CONTRIBUTING.md
引用 Vega-Altair
如果您在学术工作中使用 Vega-Altair,请考虑引用以下链接:https://joss.theoj.org/papers/10.21105/joss.01057。
@article{VanderPlas2018,
    doi = {10.21105/joss.01057},
    url = {https://doi.org/10.21105/joss.01057},
    year = {2018},
    publisher = {The Open Journal},
    volume = {3},
    number = {32},
    pages = {1057},
    author = {Jacob VanderPlas and Brian Granger and Jeffrey Heer and Dominik Moritz and Kanit Wongsuphasawat and Arvind Satyanarayan and Eitan Lees and Ilia Timofeev and Ben Welsh and Scott Sievert},
    title = {Altair: Interactive Statistical Visualizations for Python},
    journal = {Journal of Open Source Software}
}
此外,请考虑引用基于 Vega-Altair 的 Vega-Lite 项目:Vega-Lite,相关文献请参考:https://dl.acm.org/doi/10.1109/TVCG.2016.2599030
@article{Satyanarayan2017,
    author={Satyanarayan, Arvind and Moritz, Dominik and Wongsuphasawat, Kanit and Heer, Jeffrey},
    title={Vega-Lite: A Grammar of Interactive Graphics},
    journal={IEEE transactions on visualization and computer graphics},
    year={2017},
    volume={23},
    number={1},
    pages={341-350},
    publisher={IEEE}
}


下载文件
下载适合您平台的文件。如果您不确定选择哪个,请了解更多关于 安装包 的信息。
源代码分布
构建分布
altair-5.4.1.tar.gz 的散列值
| 算法 | 散列摘要 | |
|---|---|---|
| SHA256 | 0ce8c2e66546cb327e5f2d7572ec0e7c6feece816203215613962f0ec1d76a82 |
|
| MD5 | 6c6879f2df7ac185c225b16d57037030 |
|
| BLAKE2b-256 | ae0938904138a49f29e529b61b4f39954a6837f443d828c1bc57814be7bd4813 |
altair-5.4.1-py3-none-any.whl 的散列值
| 算法 | 散列摘要 | |
|---|---|---|
| SHA256 | 0fb130b8297a569d08991fb6fe763582e7569f8a04643bbd9212436e3be04aef |
|
| MD5 | 9821063efa64230581543459280ce311 |
|
| BLAKE2b-256 | 9b524a86a4fa1cc2aae79137cc9510b7080c3e5aede2310d14fae5486feec7f7 |


