Xarrays的交互式可视化
项目描述
# XrViz
[ [ [ [ [
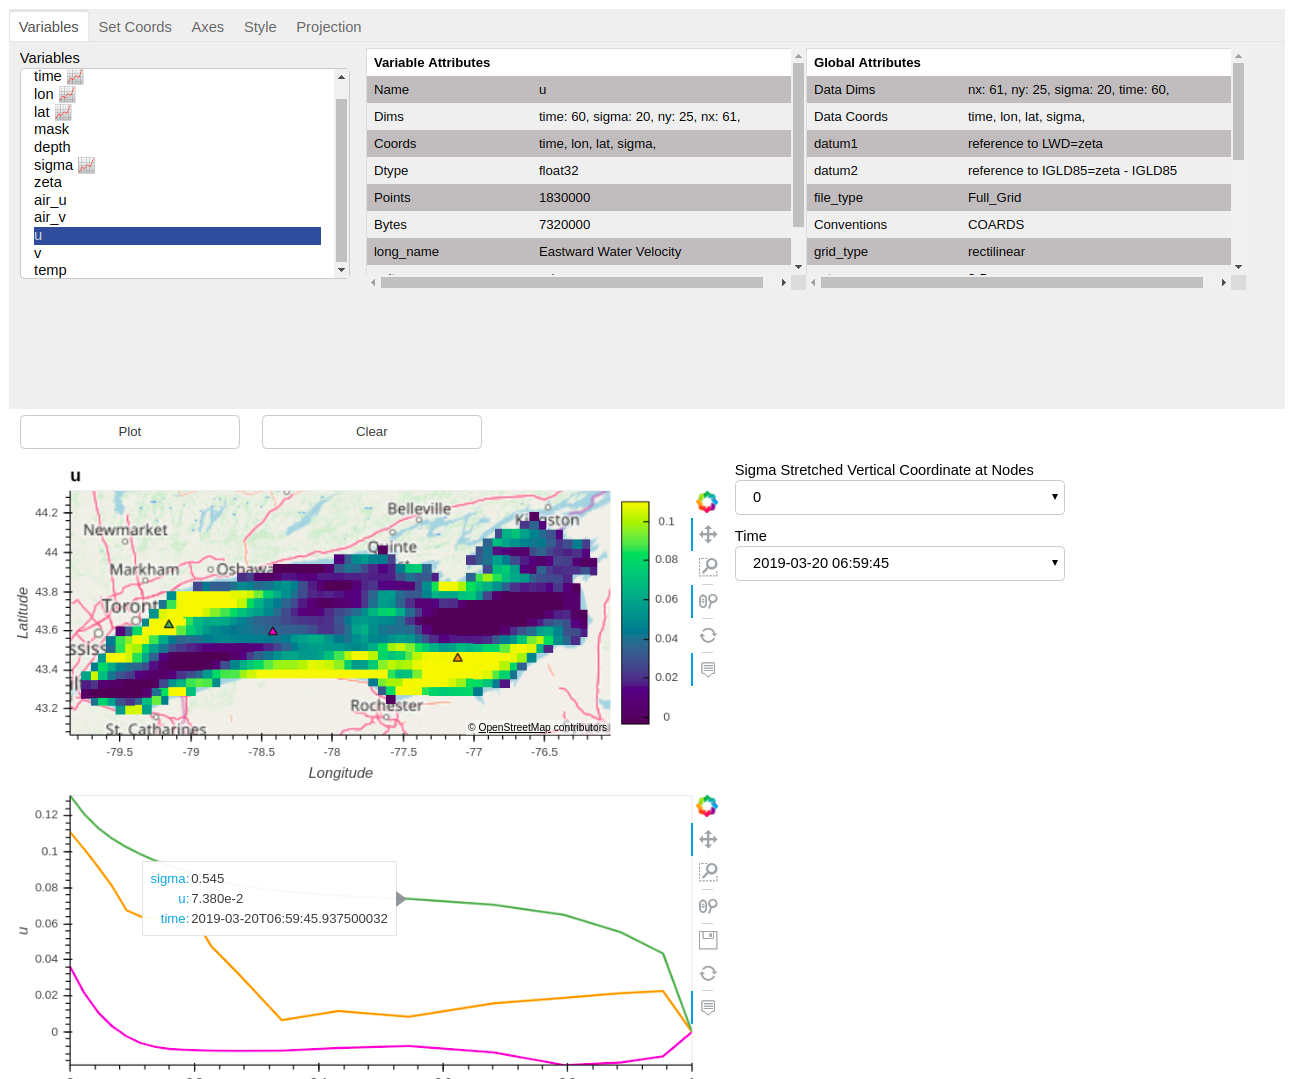
XrViz 是一个用于浏览Xarrays的交互式图形用户界面(GUI)。您可以在不同的维度上查看数据数组,检查数据值,更改颜色映射,提取序列,在地图上显示地理数据等等。它基于[Xarray](http://xarray.pydata.org)、[HvPlot](https://hvplot.pyviz.org)和[Panel](https://panel.pyviz.org/)构建。它可以与[Intake](http://intake.readthedocs.io/)一起使用,简化调查和加载数据集的过程。
文档可在[Read the Docs](https://xrviz.readthedocs.io)找到。在binder上试一试:[
<img src=”https://raw.githubusercontent.com/intake/xrviz/master/docs/source/_static/images/dashboard.png” data-canonical-src=”https://raw.githubusercontent.com/intake/xrviz/master/docs/source/_static/images/dashboard.png” width=”800”/><br>
### 安装
推荐使用 conda 的方法: ` conda install -c conda-forge xrviz `
您也可以使用 pip 进行安装: ` pip install xrviz `
### 使用说明 您可以通过在命令行中运行以下命令来查看示例仪表板(这将在一个浏览器标签中打开)
` python -c "import xrviz; xrviz.example()" `
项目详情


](https://conda.anaconda.org/conda-forge)
](https://badge.fury.io/py/xrviz)
](https://travis-ci.org/intake/xrviz)
](https://gitter.im/ESIP_GUI/community?utm_source=badge&utm_medium=badge&utm_campaign=pr-badge)
](https://mybinder.org/v2/gh/intake/xrviz/master?filepath=examples%2Fgreat_lakes.ipynb)
xrviz-0.1.4.tar.gz 的哈希值
| 算法 | 哈希摘要 | |
|---|---|---|
| SHA256 | 65deb63b695f4edcfa5d4eb85319c0f48ac43e2fbc796f7b8fd3e52be2261206 |
|
| MD5 | 40aae254a27cab9ffe04340489842039 |
|
| BLAKE2b-256 | 3af4de34b97bc119bc8d8d157cb9ffd40e6b8826e5bef4af2d3e1cffe120cea9 |