从JSONL数据生成UMAP绘图和KMeans聚类的命令行工具

项目描述
UMAP-JSONL
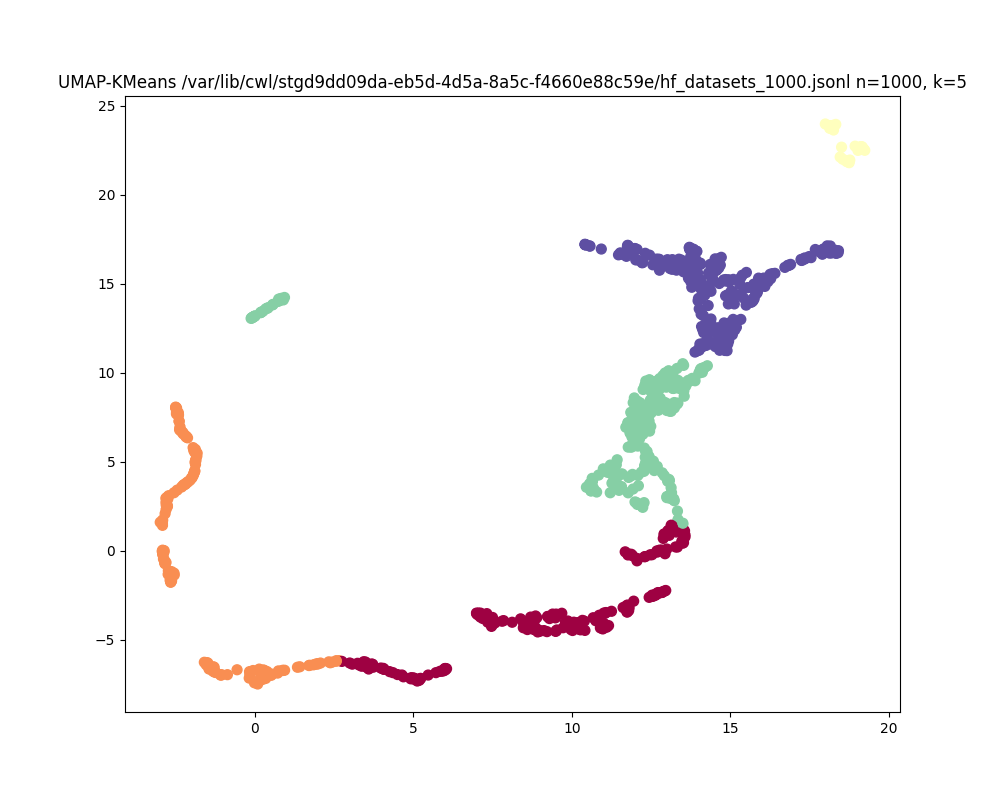
UMAP-JSONL是一个命令行工具,用于从JSONL数据文件生成UMAP绘图和KMeans聚类。此工具利用UMAP进行降维和KMeans进行聚类,以PNG格式生成可定制的可视化。
特性
- UMAP可视化:从JSONL数据创建2D UMAP绘图。
- KMeans聚类:应用可配置的聚类数量进行KMeans聚类。
- 可自定义绘图大小:设置输出绘图的大小。
- 灵活的命令行界面:轻松配置参数并指定输入/输出文件。
安装
您可以使用pip安装UMAP-JSONL
pip install umap-jsonl
使用方法
要生成具有KMeans聚类的UMAP绘图,请使用以下命令
umap-jsonl input_file <input_file> --output_file <output_file> --num_results <num_results> --n_neighbors <n_neighbors> --min_dist <min_dist> --n_components <n_components> --n_clusters <n_clusters> --plot_size <width> <height>

Command-Line Arguments

    input_file: Path to the JSONL input file.
    --output_file: Path to the output PNG file (default: output.png).
    --n_neighbors: Number of neighbors for UMAP (default: 15).
    --min_dist: Minimum distance for UMAP (default: 0.1).
    --n_components: Number of components for UMAP (default: 2).
    --n_clusters: Number of clusters for KMeans (default: 3).
    --plot_size: Size of the output plot in inches (default: 8,6). Provide width and height separated by a comma.
基本用法,提供一个.jsonl文件作为位置参数
umap-jsonl tests/hf_datasets_100000.jsonl
高级用法,设置UMAP算法的详细信息,更改绘图大小等。
umap-jsonl --input_file data.jsonl --output_file my_plot.png --num_results 10 --n_neighbors 15 --min_dist 0.2 --n_components 2 --n_clusters 4 --plot_size 10 8
开发
要为UMAP-JSONL做出贡献,请克隆存储库并安装开发依赖项
git clone https://github.com/david4096/umap-jsonl.git
cd umap-jsonl
pip install -e .
运行测试
要运行测试,请使用
python -m unittest discover -s tests
许可证
本项目的许可证为MIT许可证 - 请参阅LICENSE文件获取详细信息。联系方式
有关任何问题或问题,请联系David Steinberg,邮箱:your.email@example.com。

下载文件
下载适用于您平台的文件。如果您不确定选择哪个,请了解更多关于安装包的信息。
源代码分发
umap_jsonl-0.1.0.tar.gz (4.5 kB 查看哈希值)
构建分发
umap_jsonl-0.1.0-py3-none-any.whl (5.1 kB 查看哈希值)
关闭
umap_jsonl-0.1.0.tar.gz 的哈希值
| 算法 | 哈希摘要 | |
|---|---|---|
| SHA256 | 042d8b776d672b1ee7f3d084a46637086118d4a570e02bc06cfd81b518d0e11a |
|
| MD5 | ead06c9fa34376b243244786d11536b2 |
|
| BLAKE2b-256 | 3d46f55d877be8a440974bbfe0c66397290bedc7e7a5d95ea77997308985f9b5 |
关闭
umap_jsonl-0.1.0-py3-none-any.whl 的哈希值
| 算法 | 哈希摘要 | |
|---|---|---|
| SHA256 | 67132869aca6d915d9bd19d5e4371c09e8094864ee50b9471c4973aa42b664a4 |
|
| MD5 | 119d13c2e12cbfffde698a84768c5345 |
|
| BLAKE2b-256 | 3b499e3d5de4b5047cfb7fb0994ca1d2f1024746809d1c68af59afa79396cb18 |