Pyinstrument is a Python profiler. A profiler is a tool to help you optimize
your code - make it faster. To get the biggest speed increase you should
focus on the slowest part of your program.
Pyinstrument helps you find it!
Installation
pip install pyinstrument
Pyinstrument supports Python 3.7+.
To run Pyinstrument from a git checkout, there's a build step.
Take a look at Contributing for more info.
Documentation
To learn how to use pyinstrument, or to check the reference, head to the
documentation.
Known issues
Profiling code inside a Docker container can cause some strange results,
because the gettimeofday syscall that pyinstrument uses is slow in that
environment. See #83
When using pyinstrument script.py where script.py contains a class
serialized with pickle, you might encounter errors because the
serialisation machinery doesn't know where __main__ is. See this issue
for workarounds
Changelog
v4.0.0
Async support! Pyinstrument now detects when an async task hits an await,
and tracks time spent outside of the async context under this await.
So, for example, here's a simple script with an async task that does a
sleep:
Fix a bug that caused --show, --show-regex, --show-all to be ignored
on the command line.
v3.4.1
Under-the-hood modernisation
v3.4.0
Added timeline option (boolean) to Profiler methods output_html() and
open_in_browser().
v3.3.0
Fixed issue with pyinstrument -m module, where pyinstrument wouldn't find
modules in the current directory.
Dropped support for Python 2.7 and 3.5. Old versions will remain available
on PyPI, and pip should choose the correct one automatically.
v3.2.0
Added the ability to track time in C functions. Minor note - Pyinstrument
will record time spent C functions as 'leaf' functions, due to a limitation
in how Python records frames. Python -> C -> Python is recorded as
Python -> Python, but Python -> Python -> C will be attributed correctly.
(#103)
v3.1.2
Fix <__array_function__ internals> frames appearing as app code in reports
v3.1.1
Added support for timeline mode on HTML and JSON renderers
Released as a tarball as well as a universal wheel
v3.1.0
Added PYINSTRUMENT_SHOW_CALLBACK option on the Django middleware to
add a condition to showing the profile (could be used to run pyinstrument
on a live server!)
Fixed bug in the Django middleware where file would not be written because
of a unicode error
v3.0.3
Fixed bug with the Django middleware on Windows where profiling would fail
because we were trying to put an illegal character '?' in the profile path.
(#66)
v3.0.2
Add --show and --show-regex options, to mark certain files to be
displayed. This helps to profile inside specific modules, while hiding
others. For example, pyinstrument --show '*/sympy/*' script.py.
v3.0.1
Fix #60: pass all arguments after -m module_name to the called module
Fix crash during HTML/JSON output when no frames were captured.
v3.0.0
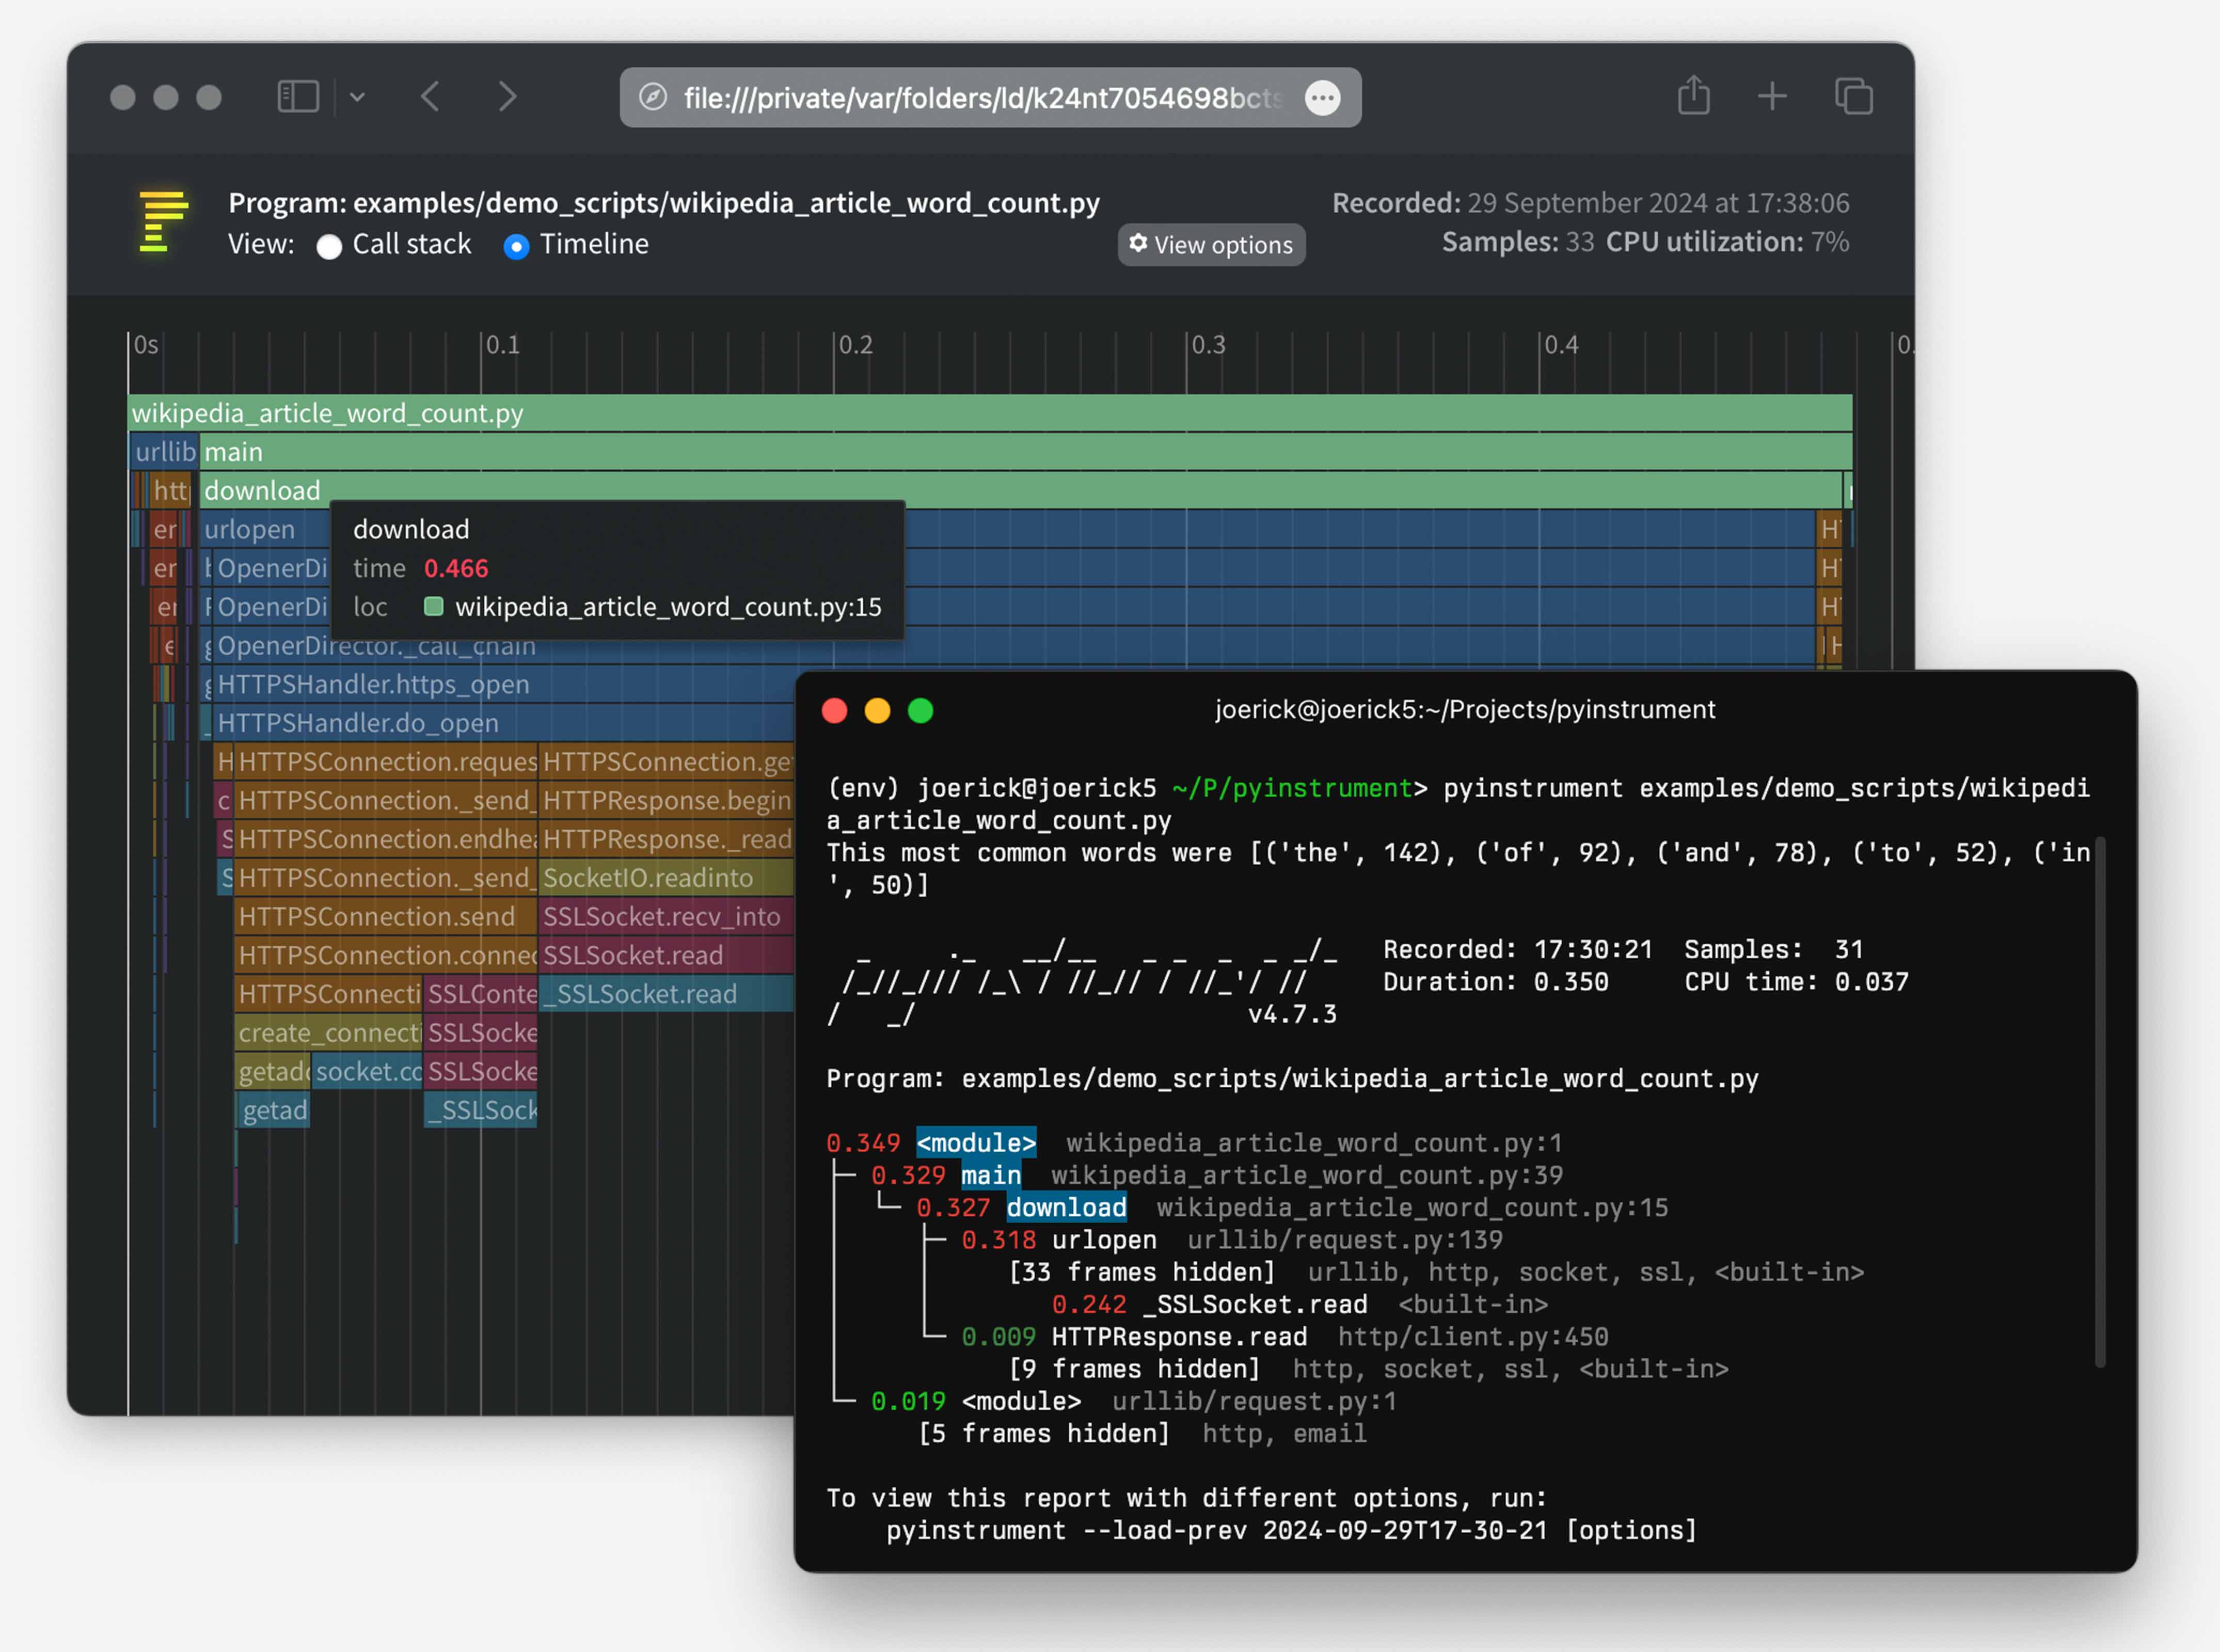
Pyinstrument will now hide traces through libraries that you're using by default. So instead of showing you loads of frames going through the internals of something external e.g. urllib, it lets you focus on your code.
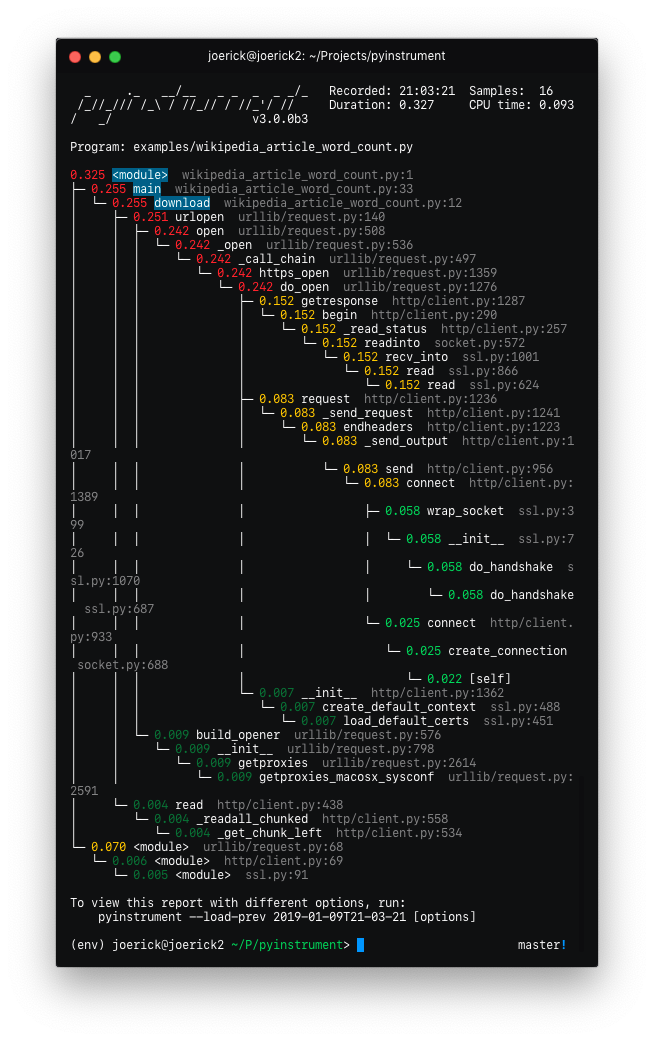
Before
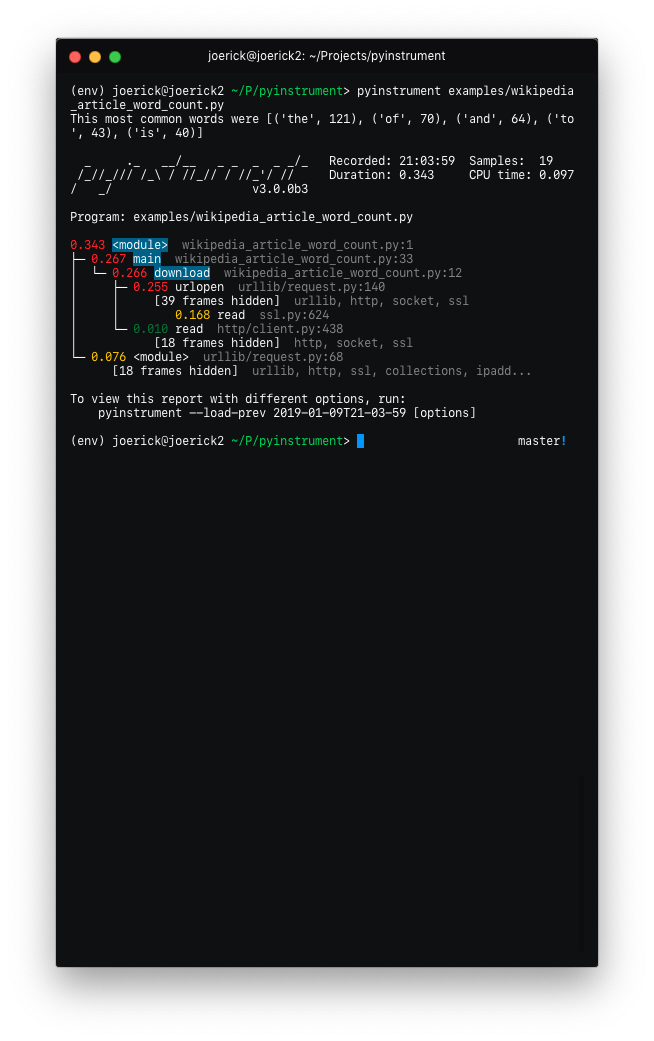
After
To go back to the old behaviour, use --show-all on the command line.
'Entry' frames of hidden groups are shown, so you know which call is the problem
Really slow frames in the groups are shown too, e.g. the 'read' call on the socket
Application code is highlighted in the console
Additional metrics are shown at the top of the trace - timestamp, number of samples, duration, CPU time
Hidden code is controlled by the --hide or --hide-regex options - matching on the path of the code files.
  --hide=EXPR           glob-style pattern matching the file paths whose
                        frames to hide. Defaults to '*/lib/*'.
  --hide-regex=REGEX    regex matching the file paths whose frames to hide.
                        Useful if --hide doesn't give enough control.
Outputting a timeline is supported from the command line.
  -t, --timeline        render as a timeline - preserve ordering and don't
                        condense repeated calls
Because there are a few rendering options now, you can load a previous profiling session using --load-prev - pyinstrument keeps the last 10 sessions.
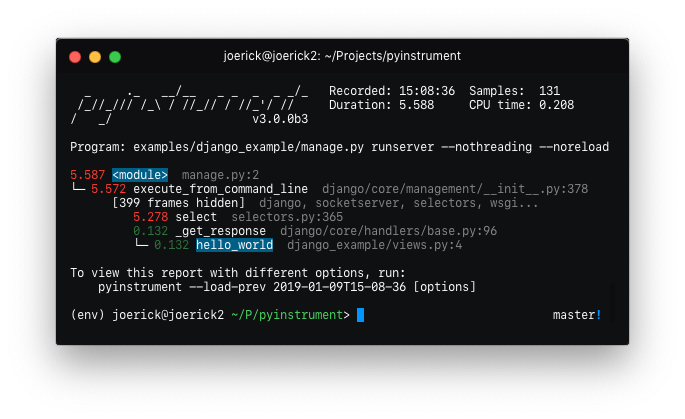
Hidden groups can also call back into application code, that looks like this:
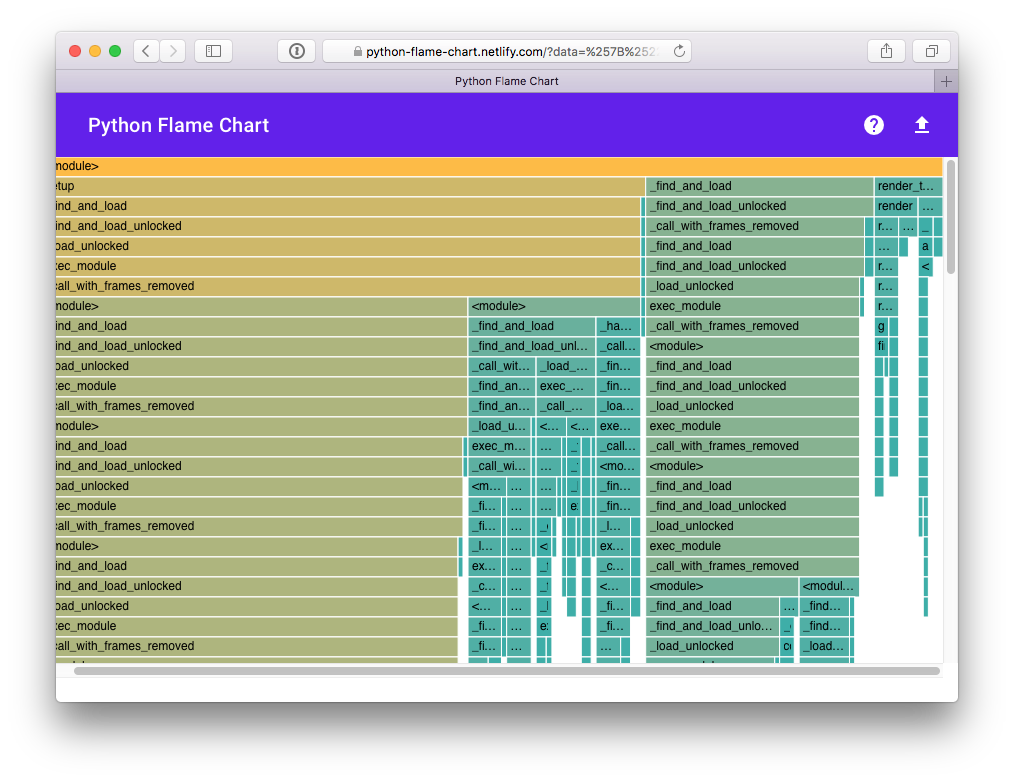
(internal) When recording timelines, frame trees are completely linear now, allowing
for the creation of super-accurate frame charts.
(internal) The HTML renderer has been rewritten as a Vue.js app. All the console improvements apply to the HTML output too, plus it's interactive.
(internal) A lot of unit and integration tests added!
Yikes! See #49 for the gory details. I hope you like it.
v2.3.0
Big refactor!
Recorders have been removed. The frame recording is now internal to the Profiler object.
This means the 'frame' objects are more general-purpose, which paves the way for...
Processors! These are functions that mutate the tree to sculpt the output.
They are used by the renderers to filter the output to the correct form. Now, instead of
a time-aggregating recorder, the profiler just uses timeline-style recording (this is
lower-overhead anyway) and the aggregation is done as a processing step.
The upshot of this is that it's now way easier to alter the tree to filter stuff out, and
do more advanced things like combining frames that we don't care about. More features to
come that use this in v3.0!
Importlib frames are removed - you won't see them at all. Their children are retained, so
imports are just transparent.
Django profile file name is now limited to a hundred of characters (#50)
Fix bug with --html option (#53)
Add --version command line option
v2.2.1
Fix crash when using on the command line.
v2.2.0
Added support for JSON output. Use pyinstrument --renderer=json scriptfile.py.
PR
When running pyinstrument --html and you don't pipe the output to a file, pyinstrument will write the console output to a temp file and open that in a browser.
v2.1.0
Added support for running modules with pyinstrument via the command line. The new syntax
is the -m flag e.g. pyinstrument -m module_name! PR
profiler = pyinstrument.Profiler()
with profiler:
    # do some work here...
print(profiler.output_text())
Middleware fix for older versions of Django
v2.0.2
Fix for max recursion error when used to profile programs with a lot of frames on the stack.
v2.0.1
Ensure license is included in the sdist.
v2.0.0
Pyinstrument uses a new profiling mode. Rather than using
signals, pyintrument uses a new statistical profiler built on
PyEval_SetProfile. This means no more main thread restriction, no more
IO errors when using Pyinstrument, and no need for a separate more
'setprofile' mode!
Renderers. Users can customize Pyinstrument to use alternative renderers
with the renderer argument on Profiler.output(), or using the --renderer
argument on the command line.
Recorders. To support other use cases of Pyinstrument (e.g. flame charts),
pyinstrument now has a 'timeline' recorder mode. This mode records captured
frames in a linear way, so the program execution can be viewed on a
timeline.
v0.13
pyinstrument command. You can now profile python scripts from the shell
by running $ pyinstrument script.py. This is now equivalent to
python -m pyinstrument. Thanks @asmeurer!
v0.12
Application code is highlighted in HTML traces to make it easier to spot
Added PYINSTRUMENT_PROFILE_DIR option to the Django interface, which
will log profiles of all requests to a file the specified folder. Useful
for profiling API calls.
Added PYINSTRUMENT_USE_SIGNAL option to the Django interface, for use
when signal mode presents problems.
The HTML renderer works by embedding a JSON representation of the sample with
a Javascript 'bundle' inside an HTML file that can be viewed in any web
browser.
To edit the html renderer style, do:
cd html_renderer
npm ci
npm run serve
When launched without a top-level window.profileSession object, it will
fetch a sample profile so you can work with it.
To compile the JS app and bundle it back into the pyinstrument python tool: