监控pandas或spark数据集的稳定性


项目描述


popmon 是一个包,允许检查数据集的稳定性。 popmon 与 pandas 和 spark datasets 都兼容。
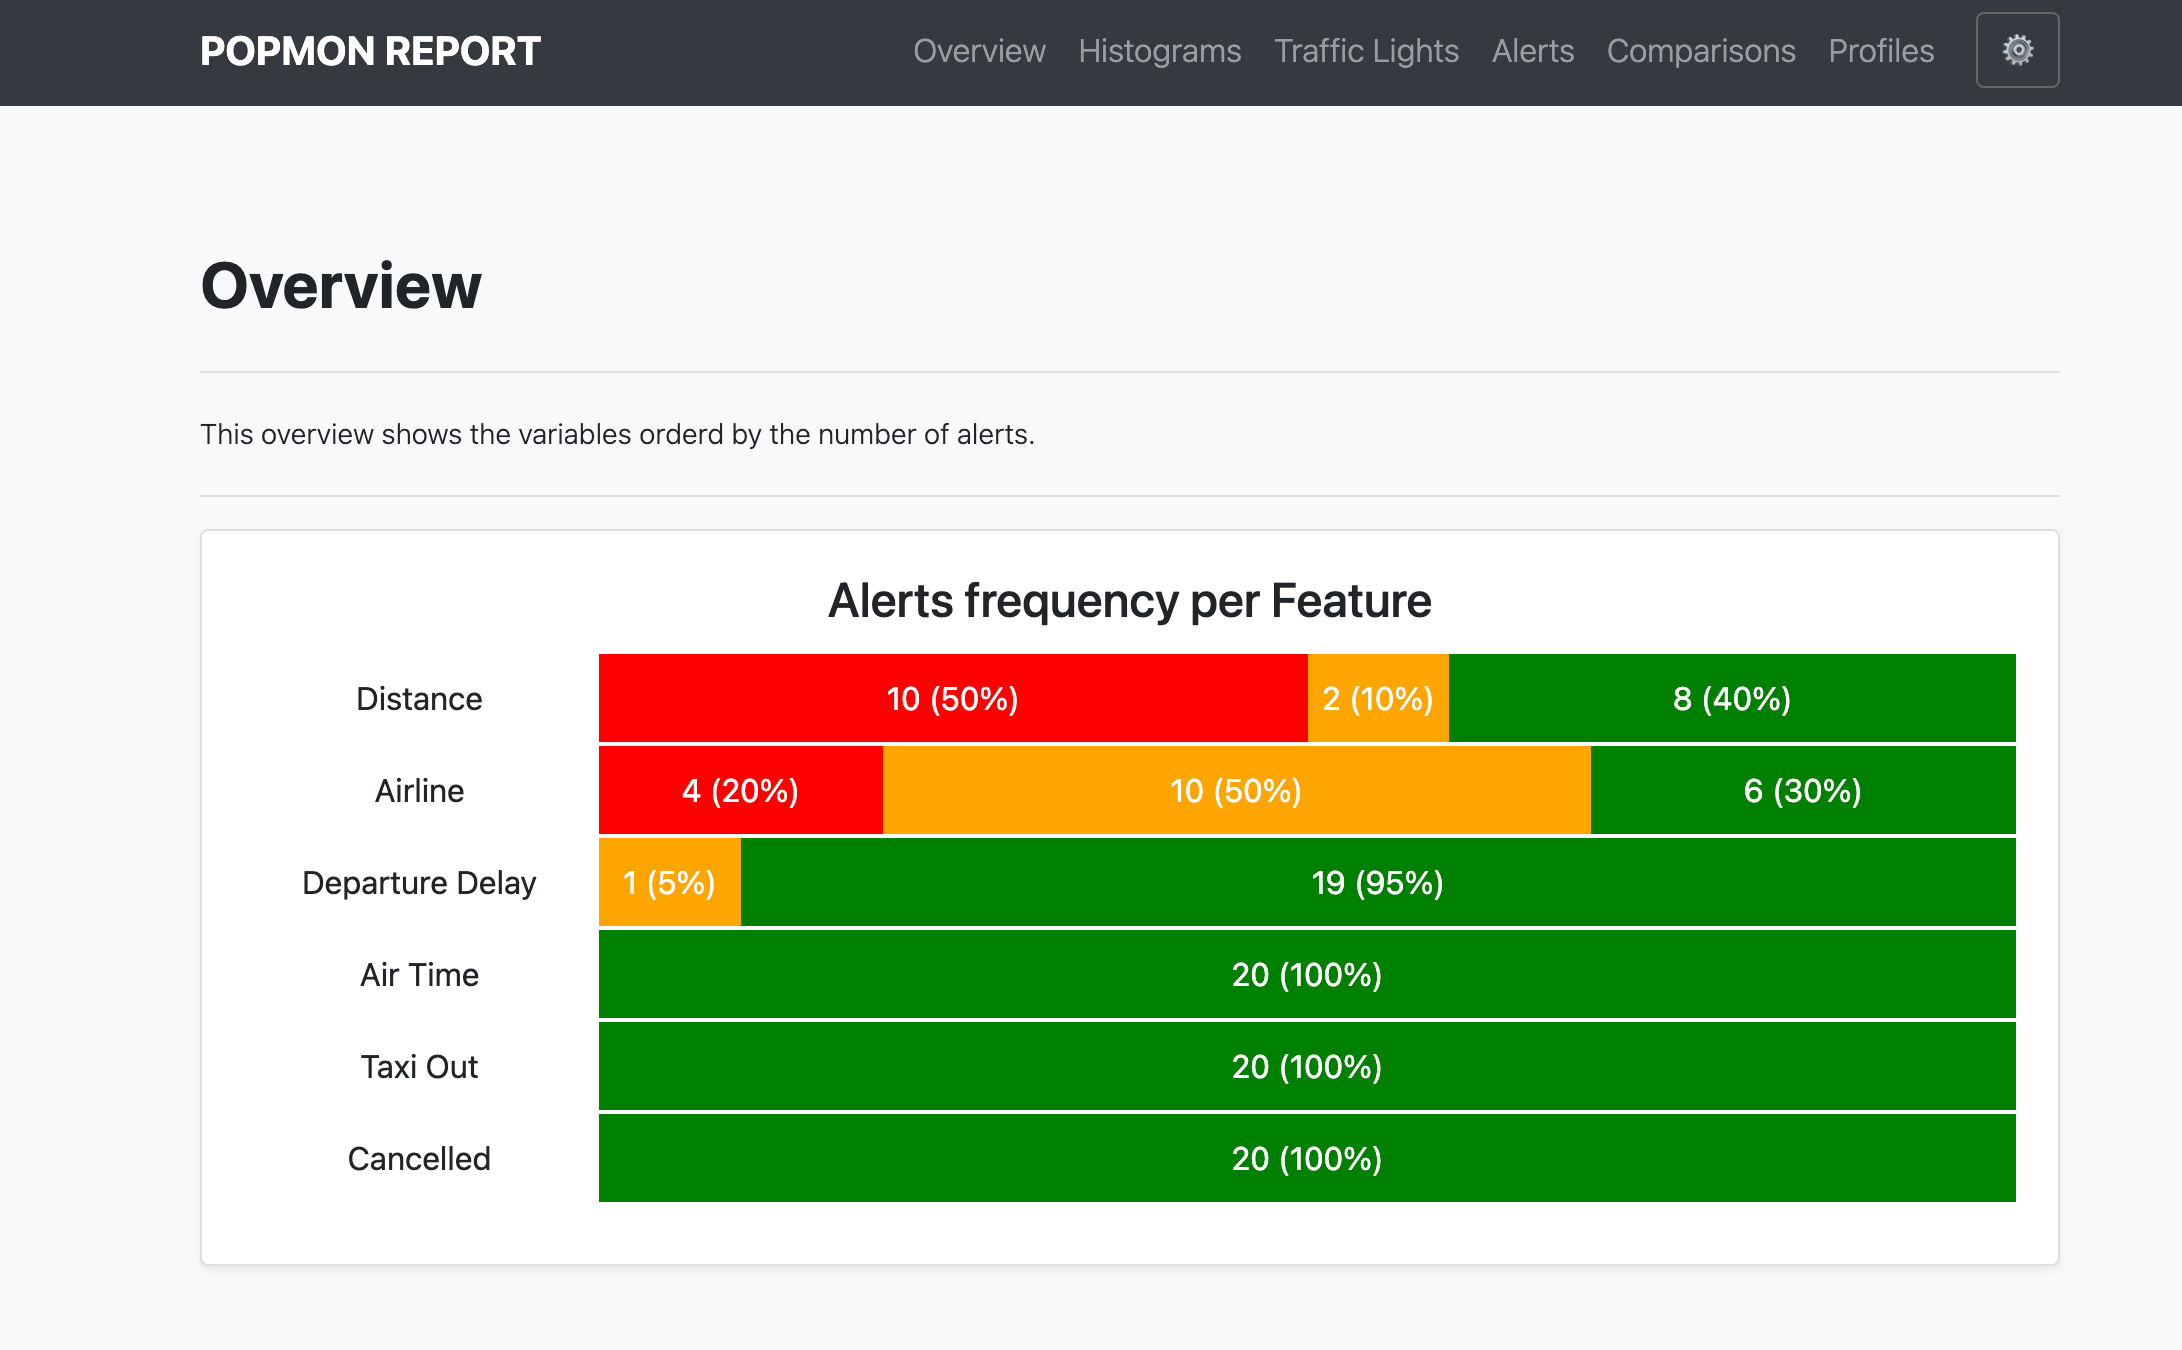
《popmon》创建时间切片分箱的特征直方图,并使用统计测试比较这些直方图的配置文件和分布的稳定性,包括时间上的变化和与参考值的比较。它可以处理数值、序数和分类特征,直方图可以是高维的,例如,它还可以跟踪任意两个特征之间的相关性。《popmon》可以使用监控业务规则自动标记和提醒时间上观察到的变化,如趋势、偏移、峰值、异常值、异常、相关性变化等。
公告
Spark 3.0
使用Spark 3.0,基于Scala 2.12,请确保选择正确的histogrammar jar文件
spark = SparkSession.builder.config(
    "spark.jars.packages",
    "io.github.histogrammar:histogrammar_2.12:1.0.20,io.github.histogrammar:histogrammar-sparksql_2.12:1.0.20",
).getOrCreate()
对于针对Scala 2.11编译的Spark 2.X,在上面的字符串中只需将2.12替换为2.11。
示例
文档
整个《popmon》文档包括教程可以在read-the-docs找到。
笔记本
教程 |
Colab链接 |
|---|---|

查看
《popmon》库需要Python 3.6+,并且支持pip。要开始,只需执行
$ pip install popmon或者查看我们GitHub仓库中的代码
$ git clone https://github.com/ing-bank/popmon.git
$ pip install -e popmon
在这个例子中,代码以编辑模式安装(选项 -e)。
现在您可以使用Python中的此包
import popmon恭喜,您现在可以使用popmon库了!
快速运行
作为一个快速示例,您可以这样做
import pandas as pd
import popmon
from popmon import resources

# open synthetic data
df = pd.read_csv(resources.data("test.csv.gz"), parse_dates=["date"])
df.head()

# generate stability report using automatic binning of all encountered features
# (importing popmon automatically adds this functionality to a dataframe)
report = df.pm_stability_report(time_axis="date", features=["date:age", "date:gender"])

# to show the output of the report in a Jupyter notebook you can simply run:
report

# or save the report to file
report.to_file("monitoring_report.html")
要指定自己的分箱规范和您想要报告的特征,您这样做
# time-axis specifications alone; all other features are auto-binned.
report = df.pm_stability_report(
    time_axis="date", time_width="1w", time_offset="2020-1-6"
)

# histogram selections. Here 'date' is the first axis of each histogram.
features = [
    "date:isActive",
    "date:age",
    "date:eyeColor",
    "date:gender",
    "date:latitude",
    "date:longitude",
    "date:isActive:age",
]

# Specify your own binning specifications for individual features or combinations thereof.
# This bin specification uses open-ended ("sparse") histograms; unspecified features get
# auto-binned. The time-axis binning, when specified here, needs to be in nanoseconds.
bin_specs = {
    "longitude": {"bin_width": 5.0, "bin_offset": 0.0},
    "latitude": {"bin_width": 5.0, "bin_offset": 0.0},
    "age": {"bin_width": 10.0, "bin_offset": 0.0},
    "date": {
        "bin_width": pd.Timedelta("4w").value,
        "bin_offset": pd.Timestamp("2015-1-1").value,
    },
}

# generate stability report
report = df.pm_stability_report(features=features, bin_specs=bin_specs, time_axis=True)这些示例也可以与spark数据框一起使用。您可以在这里查看此类示例笔记本代码的输出。有关所有可用示例,请参阅read-the-docs上的教程。
监控数据集变化的管道
高级用户可以利用popmon的模块化数据管道来自定义其工作流程。在调试或教学目的时,可视化管道可能很有用。该包中包含了一个脚本,您可以使用它。绘图是可配置的,根据您选择的选项,您将获得可用于理解数据流、高级组件和数据集(重新)使用的结果。
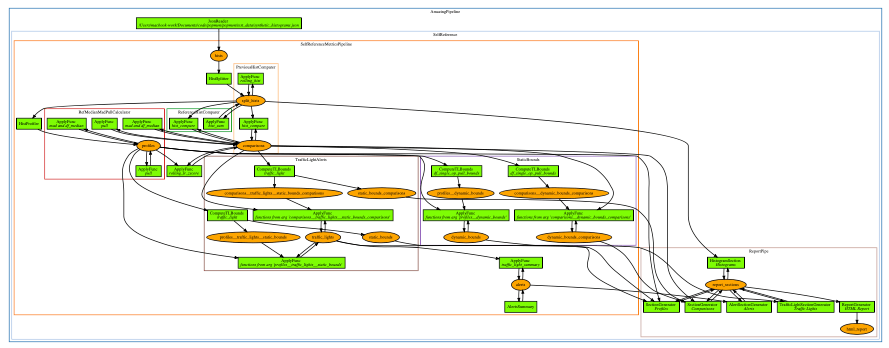
示例管道可视化(点击放大)
报告和集成
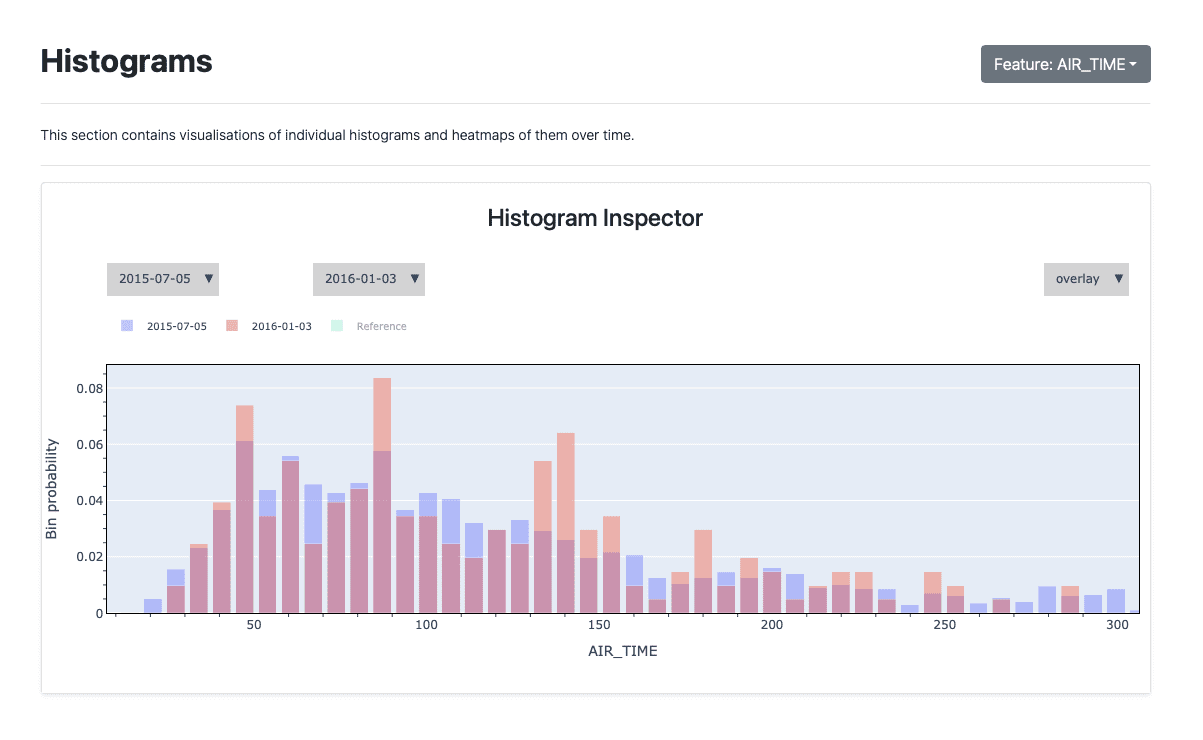
《popmon》执行的数据变化计算默认显示在一个自包含的HTML报告中。这种格式在许多实际环境中都很受欢迎,因为访问可能受到限制。此外,报告可以很容易地与他人分享。
访问数据存储意味着可以将popmon集成到几乎任何工作流程中。例如,可以将直方图数据存储在PostgreSQL数据库中,并从Grafana加载,从而利用其可视化功能和警报处理功能(例如,在警报时发送电子邮件或Slack消息)。这可能对已经投资于特定仪表板工具的团队很有趣。
可能的集成包括
Grafana |
Kibana |


有关如何集成popmon的资源可以在示例目录中找到。欢迎贡献额外的或改进的集成!
比较和配置文件扩展
可以轻松地将外部库或自定义功能添加到配置文件和比较。如果您开发了一个可以通用使用的扩展,那么请考虑将其贡献给这个包。
popmon目前集成了
双峰测试是Hartigan & Hartigan提出的单峰性测试的Python/C++实现。该测试通过对所有样本点之间的经验分布函数和最小化该最大差异的单峰分布函数之间的最大差异进行检验,以检测样本中的多峰性。除了单峰性外,它对零分布的形式不做其他假设。
要启用此扩展,请使用 pip install diptest 或 pip install popmon[diptest] 安装diptest。
资源
演示文稿
标题 |
主持人 |
日期 |
演讲者 |
popmon:数据集偏移检测分析包 |
2022年7月13日 |
Simon Brugman |
|
Popmon - 使人口监测变得简单 |
2021年2月25日 |
Simon Brugman |
|
Popmon - 使人口监测变得简单 |
2020年10月29日 |
Max Baak, Simon Brugman |
|
Popmon - 使人口监测变得简单 |
2020年10月16日 |
Max Baak |
|
2020年7月8日 |
Tomas Sostak |
||
2020年6月16日 |
Tomas Sostak |
||
Popmon:使人口偏移监测变得简单 |
2020年6月4日 |
Max Baak |
文章
标题 |
日期 |
作者 |
2022年8月3日 |
Pradyot Patil |
|
2022年4月16日 |
Jeanine Schoonemann |
|
2022年4月15日 |
Jurriaan Nagelkerke和Jeanine Schoonemann |
|
2022年11月9日 |
Simon Brugman |
|
2021年5月21日 |
Vito Gentile |
|
2020年5月20日 |
Nicole Mpozika |
软件
Kedro-popmon 是一个插件,可以将popmon报告与kedro集成。该插件允许您自动化popmon特征和输出稳定性监控的过程。由 Marian Dabrowski 和 Stephane Collot 创建。
项目贡献者
本包由ING Analytics Wholesale Banking (INGA WB) 编写。特别感谢以下为该包的开发做出贡献的人: Ahmet Erdem, Fabian Jansen, Nanne Aben, Mathieu Grimal。
引用popmon
如果 popmon 对您的工作很重要,并且您希望在您的出版物中承认该项目,我们建议引用以下论文
Brugman, S., Sostak, T., Patil, P., Baak, M. popmon:数据集偏移检测分析包. 第21届Python在科学会议论文集。161-168 (2022). (链接)
BibTeX格式
@InProceedings{ popmon-proc-scipy-2022,
  author    = { {S}imon {B}rugman and {T}omas {S}ostak and {P}radyot {P}atil and {M}ax {B}aak },
  title     = { popmon: {A}nalysis {P}ackage for {D}ataset {S}hift {D}etection },
  booktitle = { {P}roceedings of the 21st {P}ython in {S}cience {C}onference },
  pages     = { 161 - 168 },
  year      = { 2022 },
  editor    = { {M}eghann {A}garwal and {C}hris {C}alloway and {D}illon {N}iederhut and {D}avid {S}hupe },
}
联系和支持
问题 & 建议 & 支持: https://github.com/ing-bank/popmon/issues
请注意,INGA WB 只在尽力而为的基础上提供支持。
许可证
版权所有 INGA WB。 popmon 完全免费、开源,并许可在 MIT许可证 下。


下载文件
下载适合您平台的文件。如果您不确定选择哪一个,请了解有关安装包的更多信息。