一个简单的Python包,用于打印keras神经网络训练历史。

项目描述


一个Python包,用于打印Keras模型训练历史
我该如何安装此包?
像往常一样,只需使用pip下载即可
pip install plot_keras_history用法
假设你有一个由函数my_keras_model生成的模型
绘制训练历史
在以下示例中,我们将看到如何绘制和显示或保存训练历史
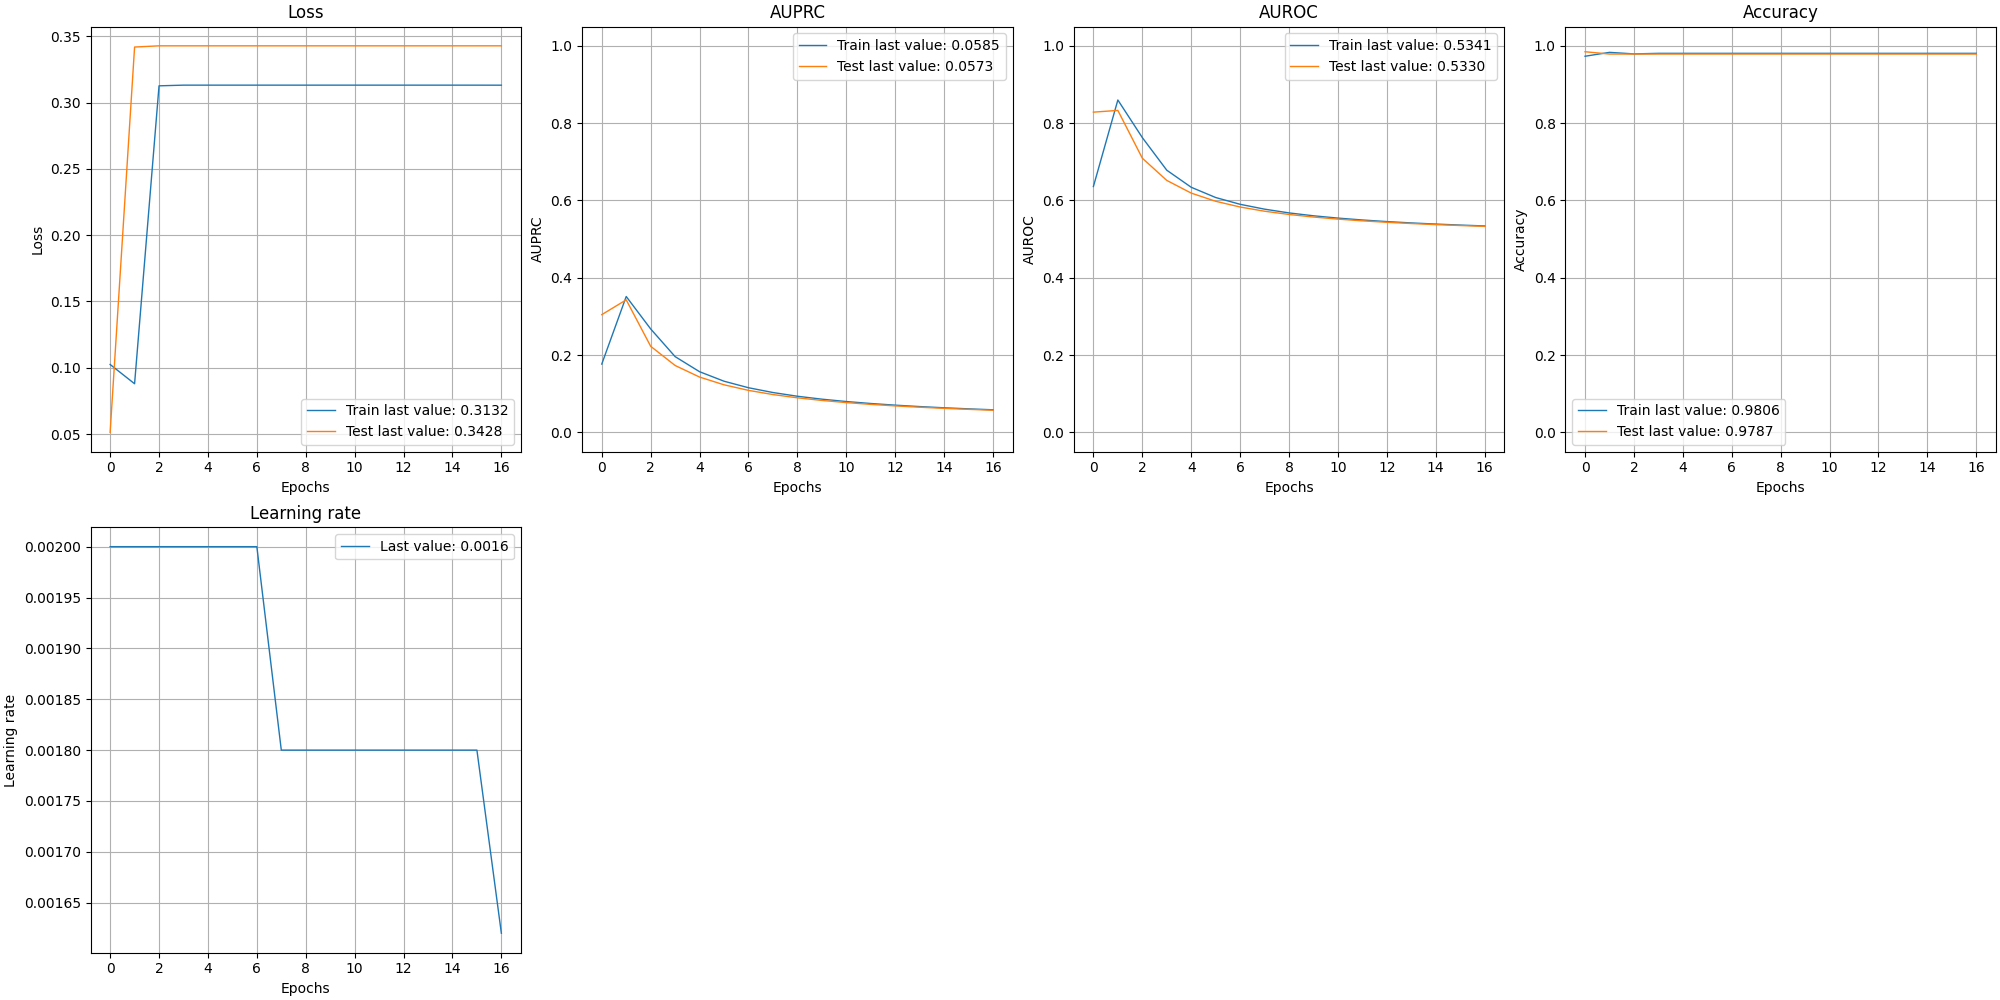
from plot_keras_history import show_history, plot_history
import matplotlib.pyplot as plt

model = my_keras_model()
history = model.fit(...)
show_history(history)
plot_history(history, path="standard.png")
plt.close()
分别绘制图形
默认情况下,所有图形都在一个大的图像中,但出于各种原因,你可能需要一个接一个地显示它们
from plot_keras_history import plot_history
import matplotlib.pyplot as plt

model = my_keras_model()
history = model.fit(...)
plot_history(history, path="singleton", single_graphs=True)
plt.close()
绘制多个历史记录
假设你正在对多个保留集进行模型训练,并且你想绘制所有这些历史记录以及平均值。幸运的是,我们已经为你准备好了!
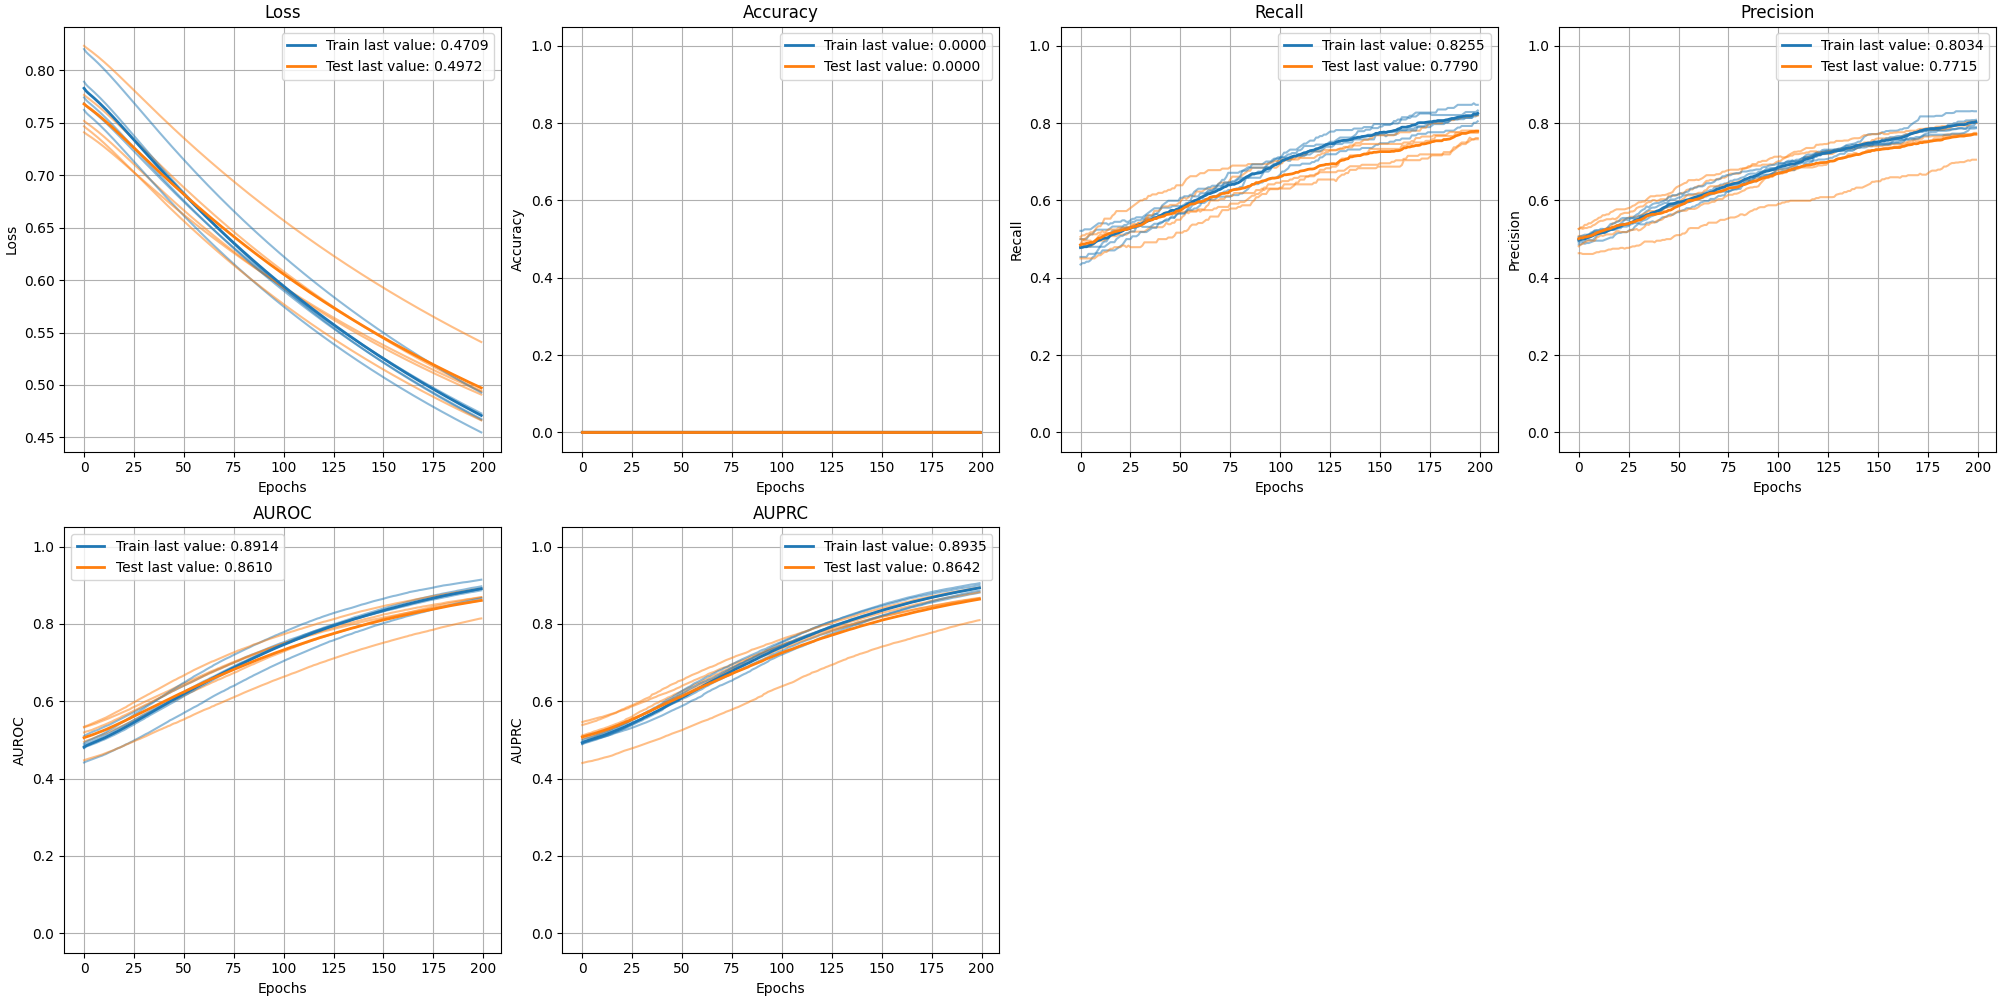
from plot_keras_history import plot_history
import matplotlib.pyplot as plt

histories = []
for holdout in range(10):
    model = my_keras_model()
    histories.append(model.fit(...))

plot_history(
    histories,
    show_standard_deviation=False,
    show_average=True
)
plt.close()
使用Savgol滤波器降低历史噪声
在某些情况下,需要能够看到历史的进展,以便将结果插值以去除一些噪声。提供了一个参数,可以自动应用Savgol滤波器
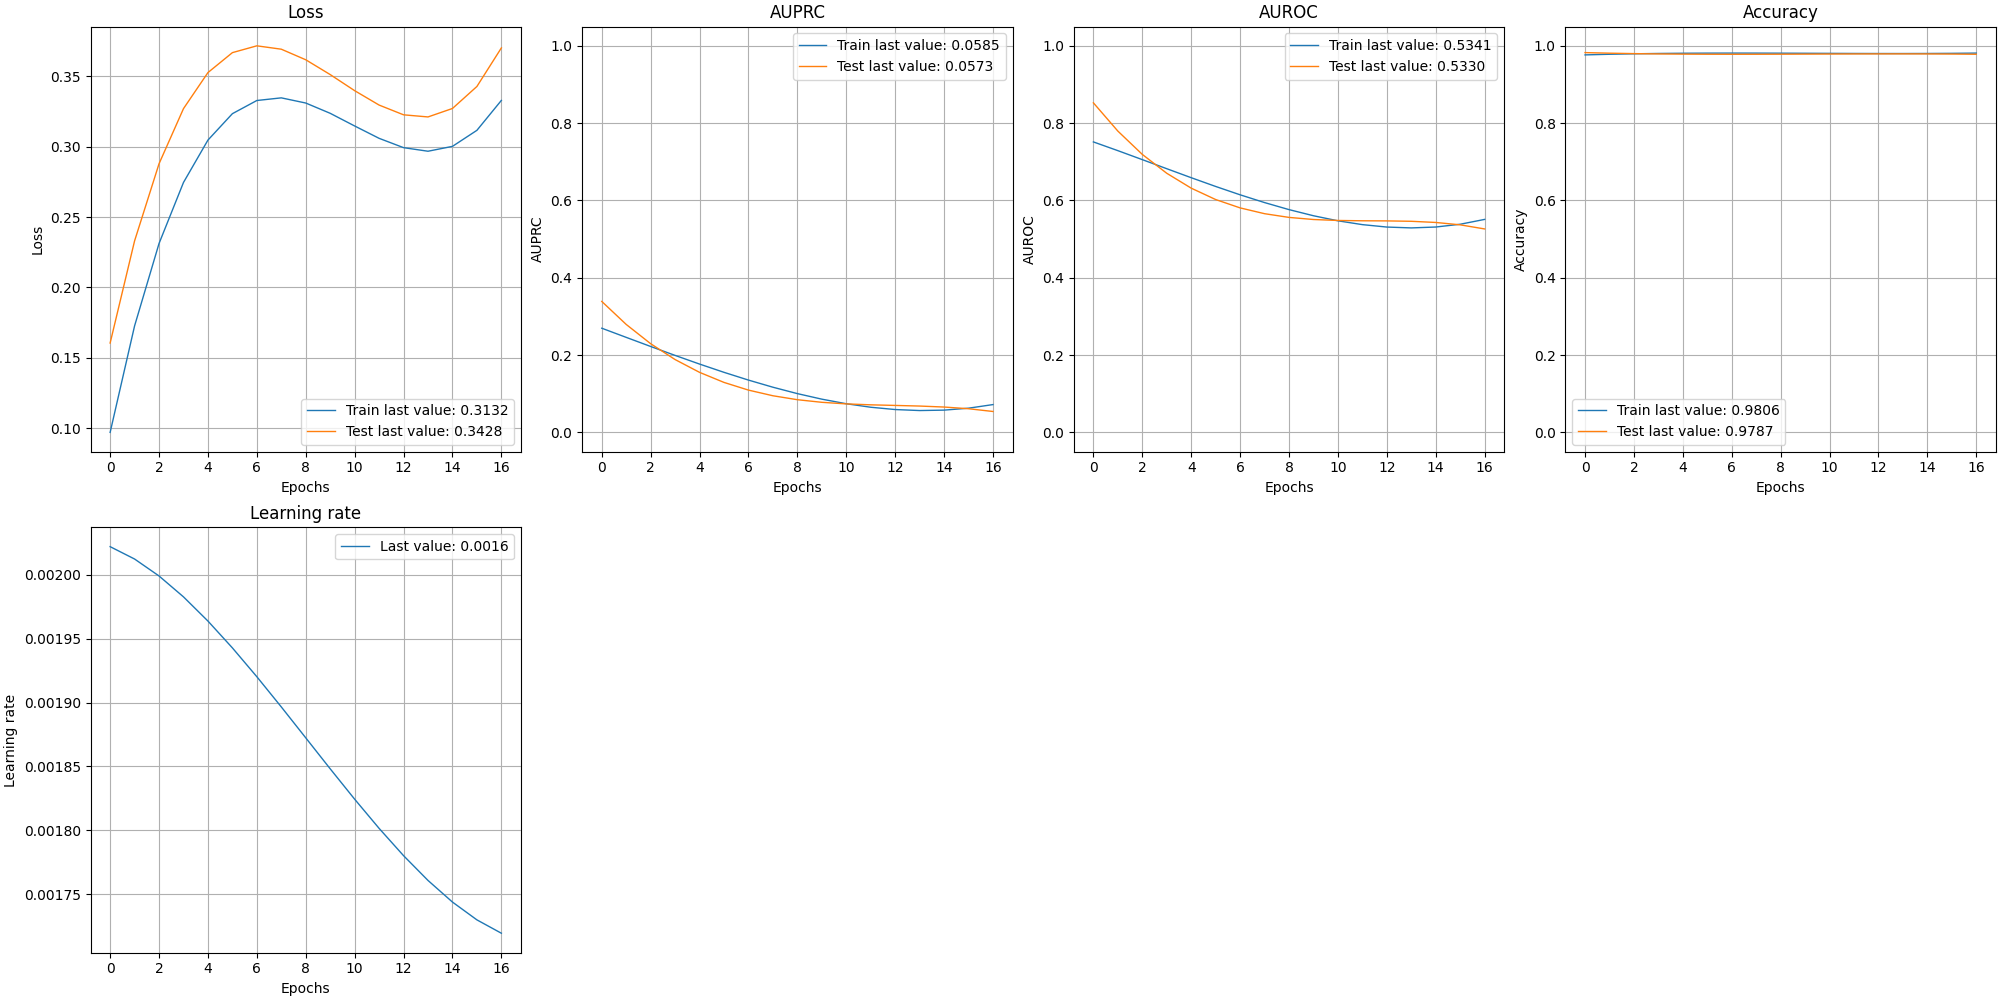
from plot_keras_history import plot_history
import matplotlib.pyplot as plt

model = my_keras_model()
history = model.fit(...)
plot_history(history, path="interpolated.png", interpolate=True)
plt.close()
自动别名
许多指标会自动从默认值转换为更易于理解的名称,例如“lr”变为“学习率”,或“acc”变为“准确率”。
自动归一化
库自动将已知范围为[-1, 1]或[0, 1]的指标范围进行归一化,以避免视觉偏差。
所有可用选项
def plot_history(
    history, # Either the history object or a pandas DataFrame. When using a dataframe, the index name is used as abscissae label.
    style:str="-", # The style of the lines.
    interpolate: bool = False, # Wethever to interpolate or not the graphs datapoints.
    side: float = 5, # Dimension of the graphs side.
    graphs_per_row: int = 4, # Number of graphs for each row.
    customization_callback: Callable = None, # Callback for customizing the graphs.
    path: str = None, # Path where to store the resulting image or images (in the case of single_graphs)
    single_graphs: bool = False #  Wethever to save the graphs as single of multiples.
)
链式历史记录
停止并重新启动模型的训练是很常见的,这会将历史对象分为两部分:因此提供了chain_histories方法
from plot_keras_history import chain_histories

model = my_keras_model()
history1 = model.fit(...)
history2 = model.fit(...)
history = chain_histories(history1, history2)
附加内容
在extra_keras_metrics中提供了许多额外的指标。
引用此软件
如果您需要引用此工作的bib文件,请在此处获取
@software{Cappelletti_Plot_Keras_History_2022,
    author = {Cappelletti, Luca},
    doi = {10.5072/zenodo.1054923},
    month = {4},
    title = {{Plot Keras History}},
    version = {1.1.36},
    year = {2022}
}

关闭
plot_keras_history-1.1.38.tar.gz的哈希值
| 算法 | 哈希摘要 | |
|---|---|---|
| SHA256 | 26a085d82124a4c2b0fed31a32dd4d92cfa2309aeda1a704d3139a9ee40c794a |
|
| MD5 | 38b47c6a7611d000b5ae107a67cfa130 |
|
| BLAKE2b-256 | 49aaf54ff192409244209cb8c40127252dcd8b81848cbd36ef4ed411d5388363 |