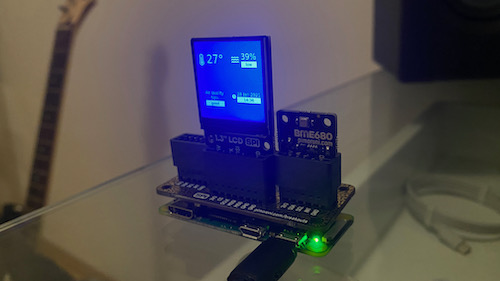
从pimoroni BME680读取数据并在pimoroni SPI屏幕上显示

项目描述


pi_weatherstation
从pimoroni BME680读取数据并在pimoroni SPI屏幕上显示
依赖项
- wkhtmltopdf(https://wkhtmltopdf.org/downloads.html)
在RaspberryPI上安装
- 启用SPI和I2C
- 安装依赖项
sudo apt-get install python3-venv python3-dev libatlas-base-dev wkhtmltopdf libopenjp2-7
- 创建存储virtualenv的文件夹
mkdir pi_weatherstation

cd pi_weatherstation
- 创建virtualenv并激活它
python3 -m venv .env

source .env/bin/activate
- 使用pip和传感器依赖项安装
pip install pi_weatherstation\[st7789,bme680\]
- 运行
pi_weatherstation -l debug
配置文件
您可以复制https://github.com/guilhermef/pi_weatherstation/blob/main/examples/config.ini中的示例配置文件
将metrics_location_label字段添加为prometheus上的位置标签。
然后您可以运行pi_weatherstation -c <config.ini的路径>
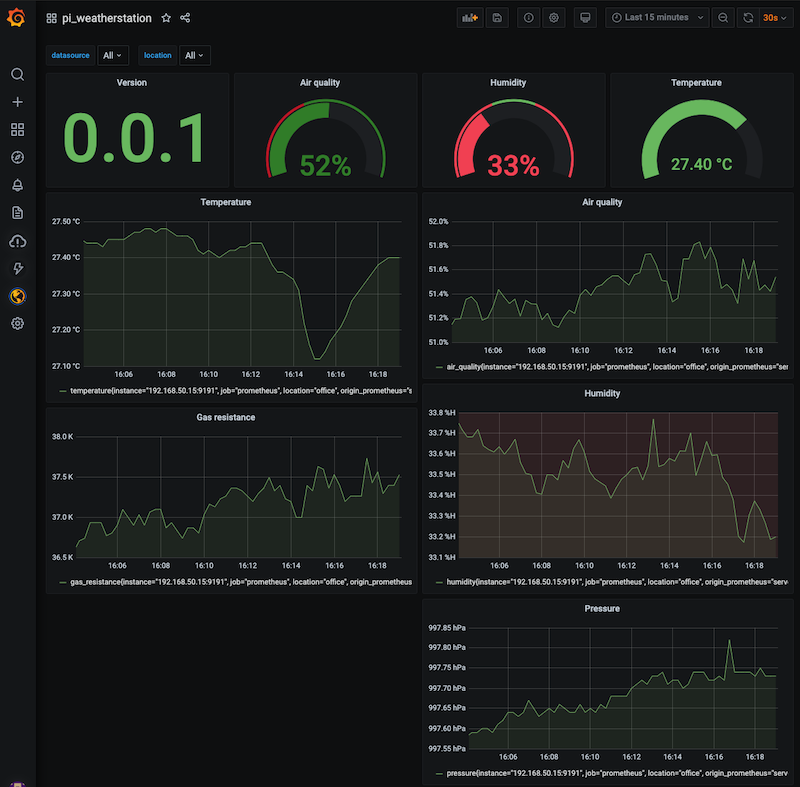
长期数据存储
这还将启动一个您可以用于抓取的prometheus指标服务器。如果您有多个实例,您可以配置标签名称位置。
将现有的prometheus.yml文件复制到抓取本地的pi_weatherstation,并添加您的远程写入认证。https://github.com/guilhermef/pi_weatherstation/blob/main/examples/prometheus.yml
在您的Grafana中导入示例仪表板:https://github.com/guilhermef/pi_weatherstation/blob/main/examples/grafana_dashboard.json
作为服务运行
如果您愿意,可以使用https://github.com/guilhermef/pi_weatherstation/blob/main/examples/pi_weatherstation.service作为示例系统服务单元文件并将其放置在/etc/systemd/system/pi_weatherstation.service
然后,运行
sudo systemctl daemon-reload
sudo systemctl enable pi_weatherstation.service
sudo systemctl start pi_weatherstation.service


关闭
pi_weatherstation-0.0.5.tar.gz的哈希值
| 算法 | 哈希摘要 | |
|---|---|---|
| SHA256 | bcdee59e629bd64c599b97017c259617577b2e926a3e3a3f31f364cffc51678f |
|
| MD5 | 1a1c017667e4f5ee0a48ac08f688c22c |
|
| BLAKE2b-256 | 2d8c87c3d7a909ebeee5409fdeb3316b0d26bceb59b636ab0bb6c833f5e5709b |
关闭
pi_weatherstation-0.0.5-py2.py3-none-any.whl的哈希值
| 算法 | 哈希摘要 | |
|---|---|---|
| SHA256 | f1ae089ded7213cdd77151454aed8da1e10de46518a00d9b71fe91c34fde584a |
|
| MD5 | c6d854db1deb83535e787f10391199c4 |
|
| BLAKE2b-256 | 567cb09f3f656d118f5bc8b3646c76f6bbd2c2c8f69c580b5ee234f9beea1fc1 |