optuna-dashboard 0.10.2
pip install optuna-dashboard==0.10.2
Released:
Real-time dashboard for Optuna
Navigation
Verified details
These details have been verified by PyPIMaintainers
 c-bata
 contramundum53
 knshnb
 mamu
mamu
 nabenabe0928
 not
not
 toshihikoyanase
Unverified details
These details have not been verified by PyPIProject links
Meta
- License: MIT License (MIT License)
- Author: Masashi Shibata
- Requires: Python >=3.7
Classifiers
- Development Status
- Intended Audience
- License
- Programming Language
Project description
optuna-dashboard
Real-time dashboard for Optuna. Code files were originally taken from Goptuna.
Installation
You can install optuna-dashboard via PyPI or Anaconda Cloud.
$ pip install optuna-dashboard
Getting Started
First, please specify the storage URL to persistent your study using the RDB backend.
import optuna

def objective(trial):
    x = trial.suggest_float("x", -100, 100)
    y = trial.suggest_categorical("y", [-1, 0, 1])
    return x**2 + y

if __name__ == "__main__":
    study = optuna.create_study(
        storage="sqlite:///db.sqlite3",  # Specify the storage URL here.
        study_name="quadratic-simple"
    )
    study.optimize(objective, n_trials=100)
    print(f"Best value: {study.best_value} (params: {study.best_params})")
After running the above script, please execute the optuna-dashboard command with Optuna storage URL.
$ optuna-dashboard sqlite:///db.sqlite3
Listening on http://localhost:8080/
Hit Ctrl-C to quit.
Please check out our documentation for more details.
Using an official Docker image
You can also use an official Docker image instead of setting up your Python environment. The Docker image only supports SQLite3, MySQL(PyMySQL), and PostgreSQL(Psycopg2).
$ docker run -it --rm -p 8080:8080 -v `pwd`:/app -w /app \
> ghcr.io/optuna/optuna-dashboard sqlite:///db.sqlite3
MySQL (PyMySQL)
$ docker run -it --rm -p 8080:8080 ghcr.io/optuna/optuna-dashboard mysql+pymysql://username:password@hostname:3306/dbname
PostgreSQL (Psycopg2)
$ docker run -it --rm -p 8080:8080 ghcr.io/optuna/optuna-dashboard postgresql+psycopg2://username:password@hostname:5432/dbname
Features
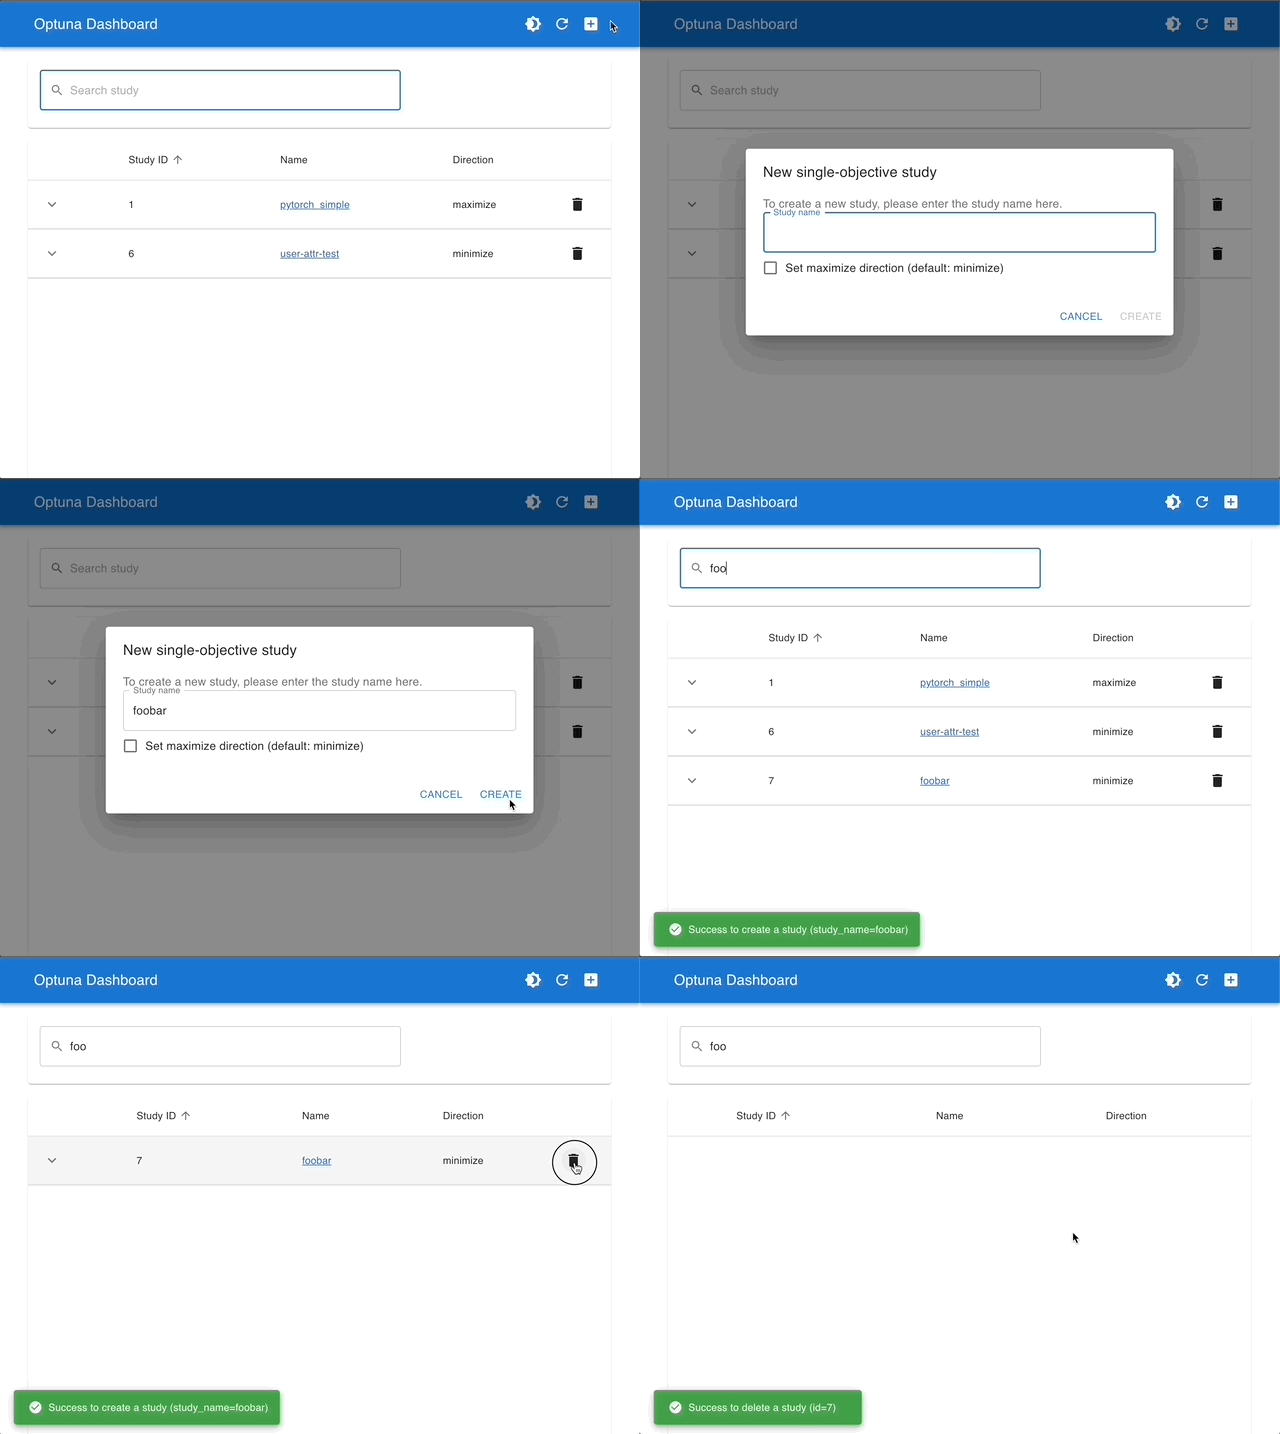
Manage Studies
You can create and delete studies from Dashboard.
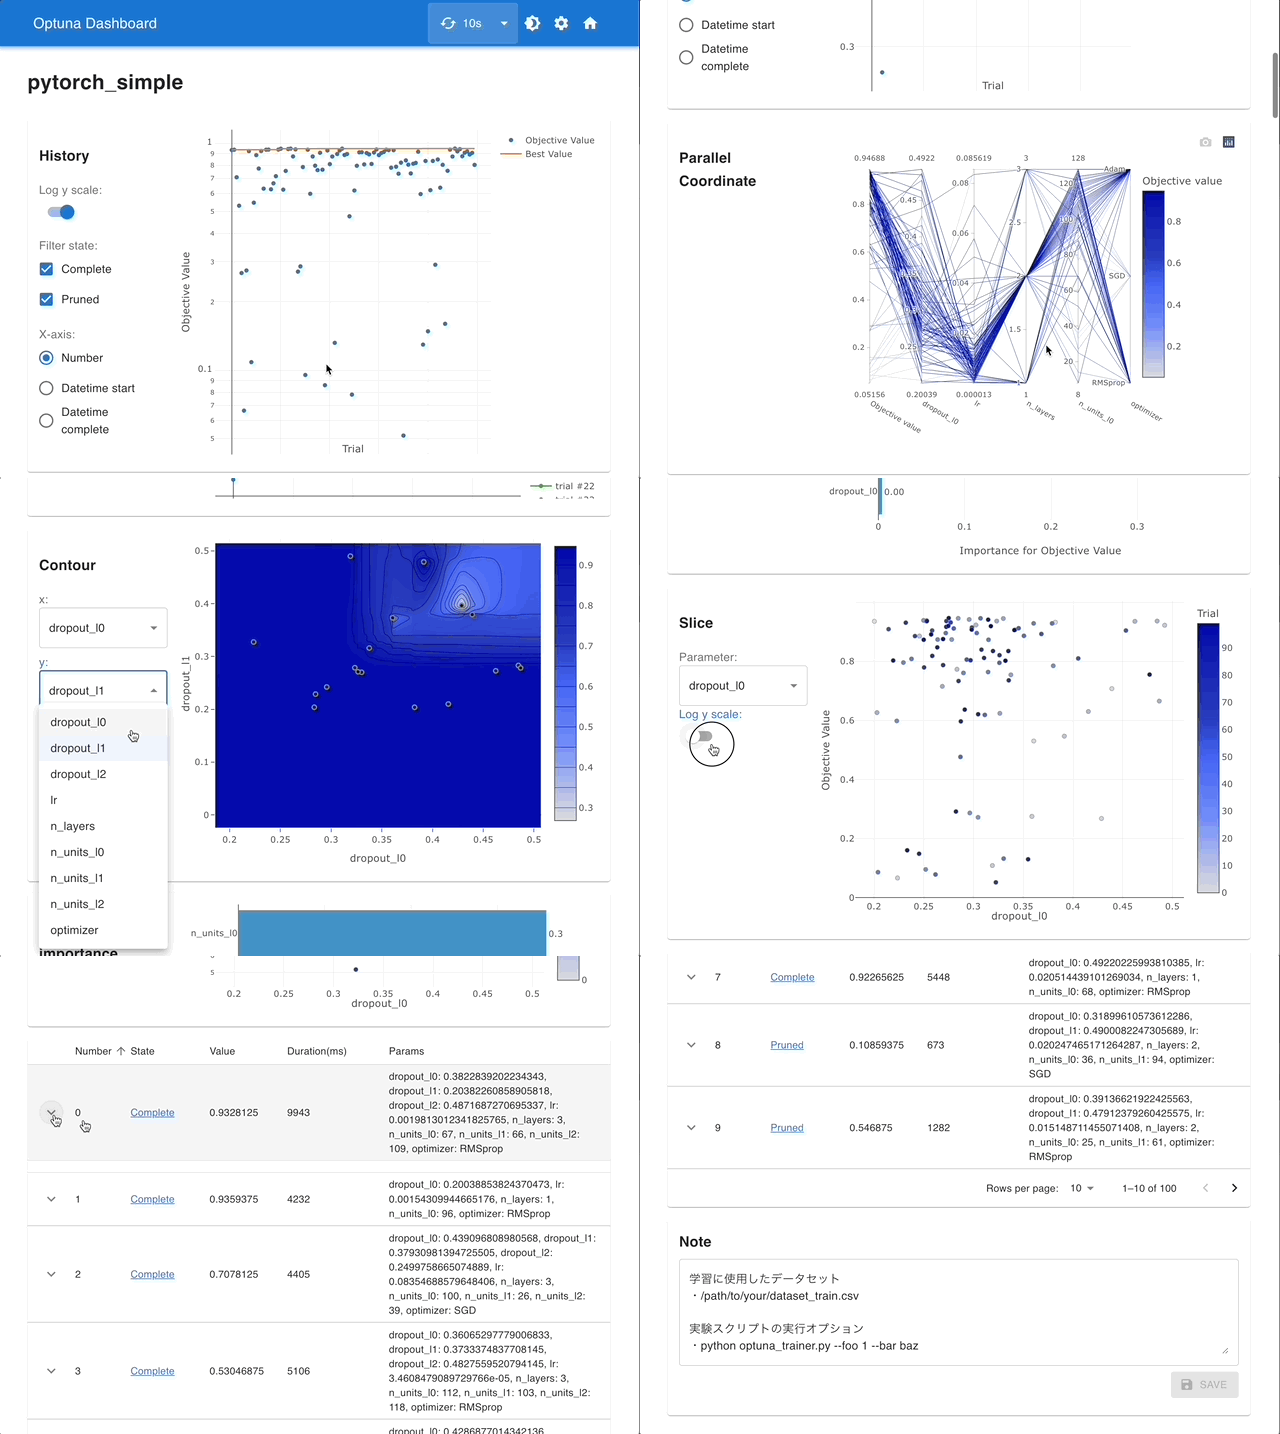
Visualize with Interactive Graphs & Rich Trials Data Grid
You can check the optimization history, hyperparameter importances, etc. in graphs and tables.
Submitting patches
If you want to contribute, please check Developers Guide.
Project details
Verified details
These details have been verified by PyPIMaintainers
 c-bata
 contramundum53
 knshnb
 mamu
mamu
 nabenabe0928
 not
not
 toshihikoyanase
Unverified details
These details have not been verified by PyPIProject links
Meta
- License: MIT License (MIT License)
- Author: Masashi Shibata
- Requires: Python >=3.7
Classifiers
- Development Status
- Intended Audience
- License
- Programming Language
Release history Release notifications | RSS feed
Download files
Download the file for your platform. If you're not sure which to choose, learn more about installing packages.
Source Distribution
Built Distribution
File details
Details for the file optuna-dashboard-0.10.2.tar.gz.
File metadata
- Download URL: optuna-dashboard-0.10.2.tar.gz
- Upload date:
- Size: 4.5 MB
- Tags: Source
- Uploaded using Trusted Publishing? No
- Uploaded via: twine/4.0.1 CPython/3.11.4
File hashes
| Algorithm | Hash digest | |
|---|---|---|
| SHA256 |
9b8ec78aaa90bf80a236133f459c1fb913adba727726b0faeb5753c376d5eb8e
|
|
| MD5 |
4e02aa7096a7973f7053e2953124ef45
|
|
| BLAKE2b-256 |
44688bdc7d9c94960368f858b12b9c9b6c6c48d55905a733fcd2fec988294089
|
File details
Details for the file optuna_dashboard-0.10.2-py3-none-any.whl.
File metadata
- Download URL: optuna_dashboard-0.10.2-py3-none-any.whl
- Upload date:
- Size: 4.5 MB
- Tags: Python 3
- Uploaded using Trusted Publishing? No
- Uploaded via: twine/4.0.1 CPython/3.11.4
File hashes
| Algorithm | Hash digest | |
|---|---|---|
| SHA256 |
b7081466af5531b0e6e2ec6a8d8043baeefd38d0e8ebc9fa4d055fceefc8e7c1
|
|
| MD5 |
8e2e3f405f71e15e876de7158a21580d
|
|
| BLAKE2b-256 |
aa5b994fa83a7370ed0cf62fdac681f86fb0d13009dc862e4602232fba5a49c5
|


