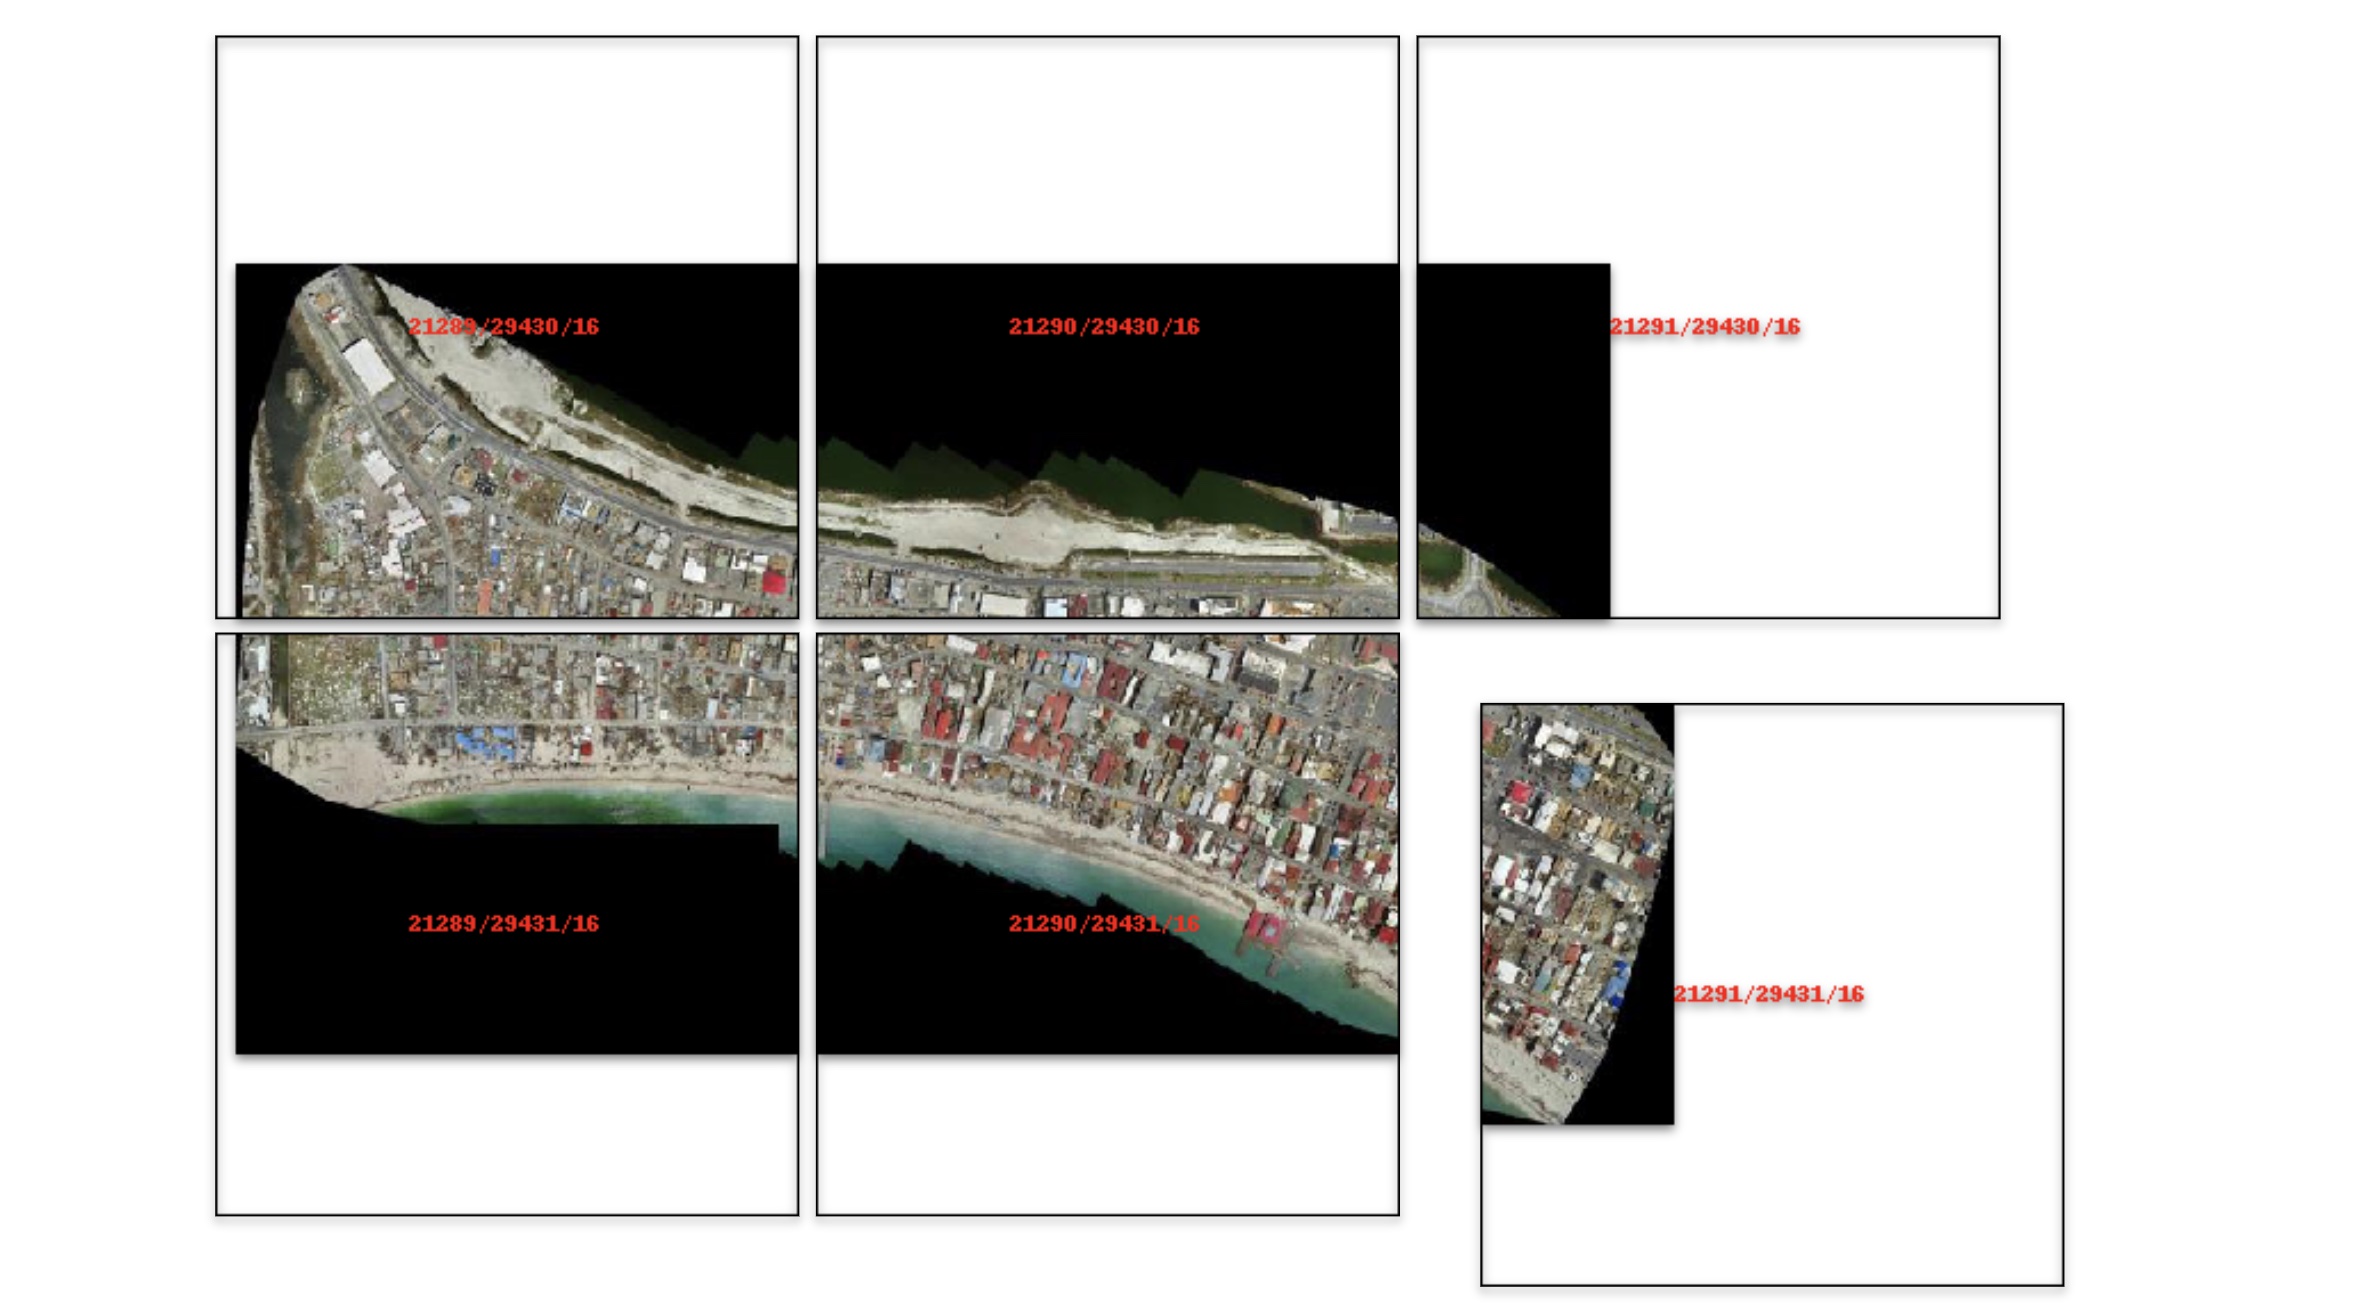
在Slippy Map标准中本地提供地理空间栅格瓦片。

项目描述
🌐 地理空间栅格的本地瓦片服务器


需要可视化一个相当大的(数GB)栅格吗? 这是为你准备的。
一个Python包,用于从大型的栅格文件中提供符合Slippy Maps标准(即,/zoom/x/y.png)的瓦片,以便在Jupyter中使用ipyleaflet或folium进行可视化。
在MyBinder上启动演示

文档: https://localtileserver.banesullivan.com/
基于 rio-tiler 构建
🌟 突出亮点
- 启动大型地理空间图像的瓦片服务器
- 在Jupyter中使用
ipyleaflet或folium查看本地或远程*栅格文件 - 使用内置的Web应用程序使用CesiumJS查看栅格
*远程栅格文件应该是预切片的Cloud Optimized GeoTiffs
🚀 用法
用法详情和示例可以在文档中找到: https://localtileserver.banesullivan.com/
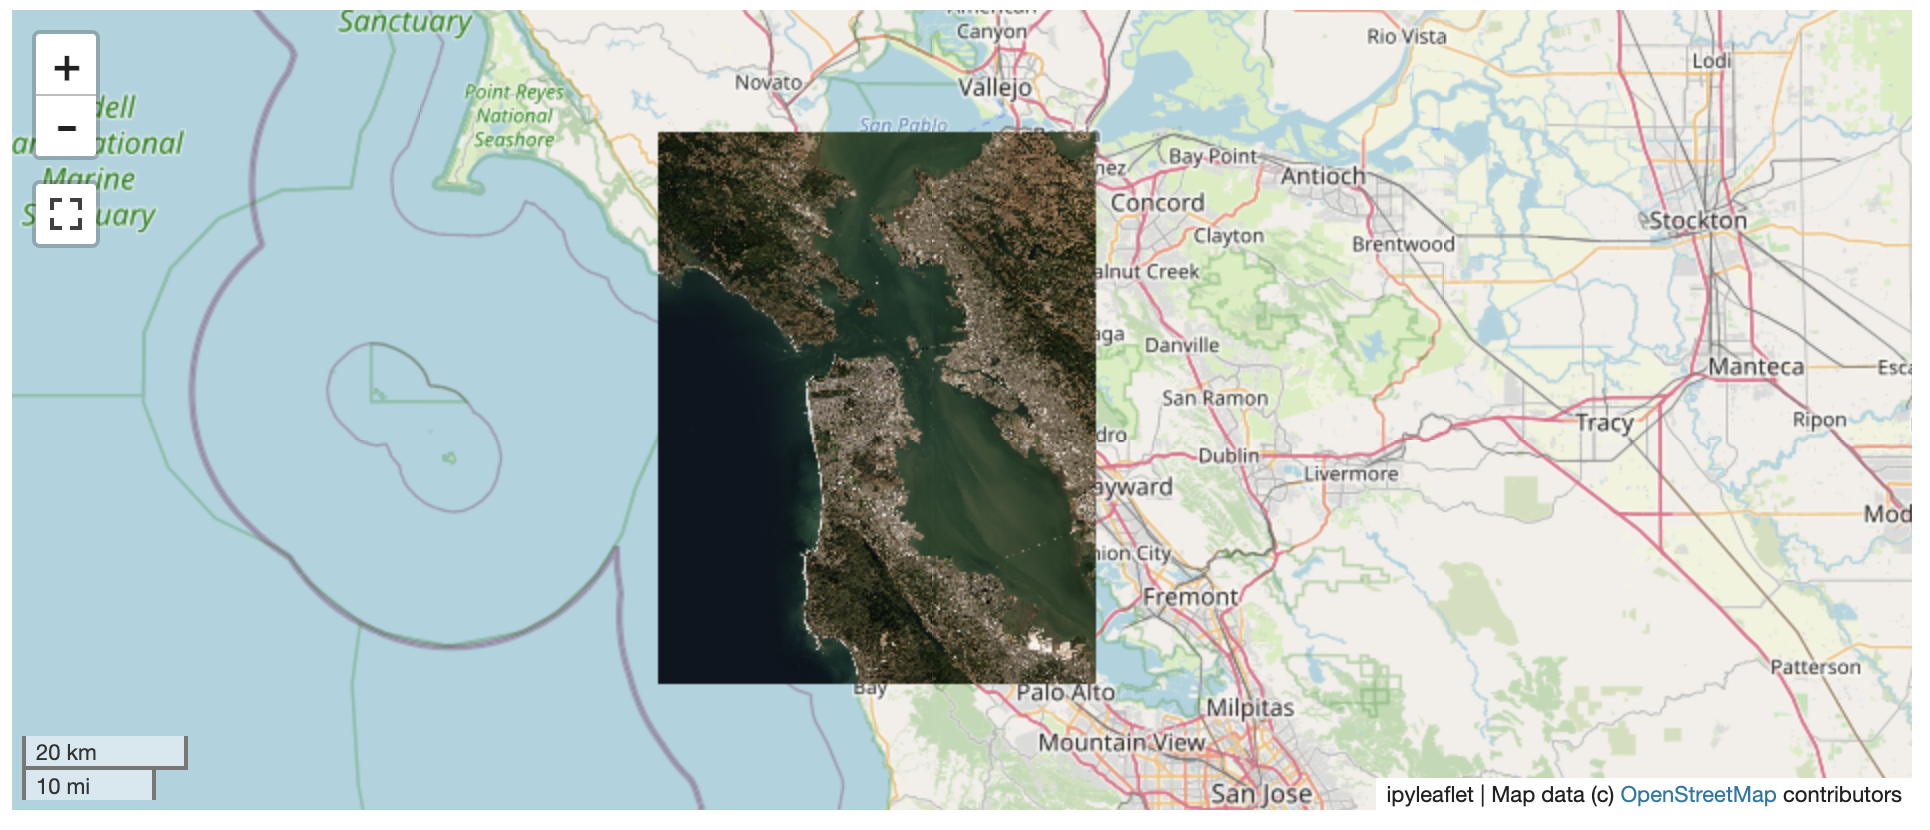
以下是一个使用ipyleaflet可视化本地栅格文件的最小示例
from localtileserver import get_leaflet_tile_layer, TileClient
from ipyleaflet import Map

# First, create a tile server from local raster file
client = TileClient('path/to/geo.tif')

# Create ipyleaflet tile layer from that server
t = get_leaflet_tile_layer(client)

m = Map(center=client.center(), zoom=client.default_zoom)
m.add(t)
m
ℹ️ 概述
可以使用 TileClient 类在后台线程中启动瓦片服务器,该服务器将为查看器(通常是在 Jupyter 笔记本中的 ipyleaflet 或 folium)提供栅格影像。
该瓦片服务器可以高效地将不同分辨率的栅格影像发送给查看器;预先分块的、云优化地理TIFF(COGs) 非常有帮助。
包含一个基于 CesiumJS 的独立网页查看器。
⬇️ 安装
使用 localtileserver 开始在 Jupyter 中查看栅格影像或将其部署为自己的 Flask 应用程序。
🐍 使用 conda 安装
Conda 使得管理 localtileserver 在不同平台上的依赖变得相当简单,这是推荐的安装方法
conda install -c conda-forge localtileserver
🎡 使用 pip 安装
如果您更喜欢 pip,则可以从 PyPI 安装:[https://pypi.ac.cn/project/localtileserver/](https://pypi.ac.cn/project/localtileserver/)
pip install localtileserver
💭 反馈
请在 讨论区 分享您的想法和问题。如果您想报告任何错误或提出功能请求,请创建一个问题。
如果提交错误报告,请共享 scooby Report
import localtileserver
print(localtileserver.Report())


下载文件
下载适合您平台的文件。如果您不确定选择哪个,请了解有关 安装包 的更多信息。


