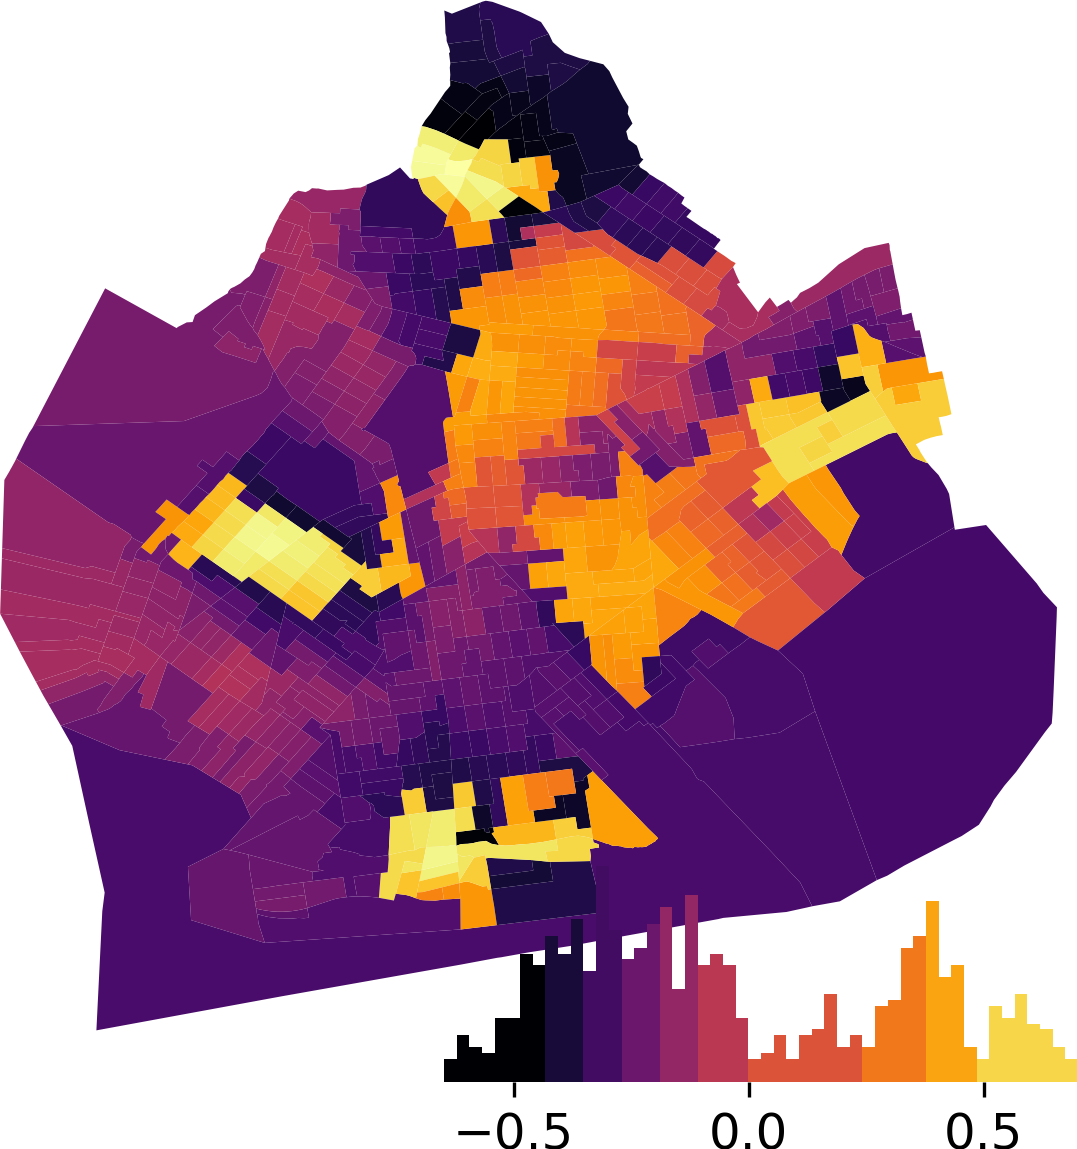
Legendgrams是地图图例,用于可视化给定地图中观测值的颜色分布


项目描述
这是一个提供legendgrams的小型未经过单元测试、可复制的代码。Legendgrams是地图图例,用于可视化给定地图中观测值的颜色分布
Legendgrams由PySAL分发,PySAL是一个开源的跨平台空间分析函数库,用Python编写。它旨在支持高级空间分析应用的开发。
要使用legendgrams,只需使用pip安装该软件包
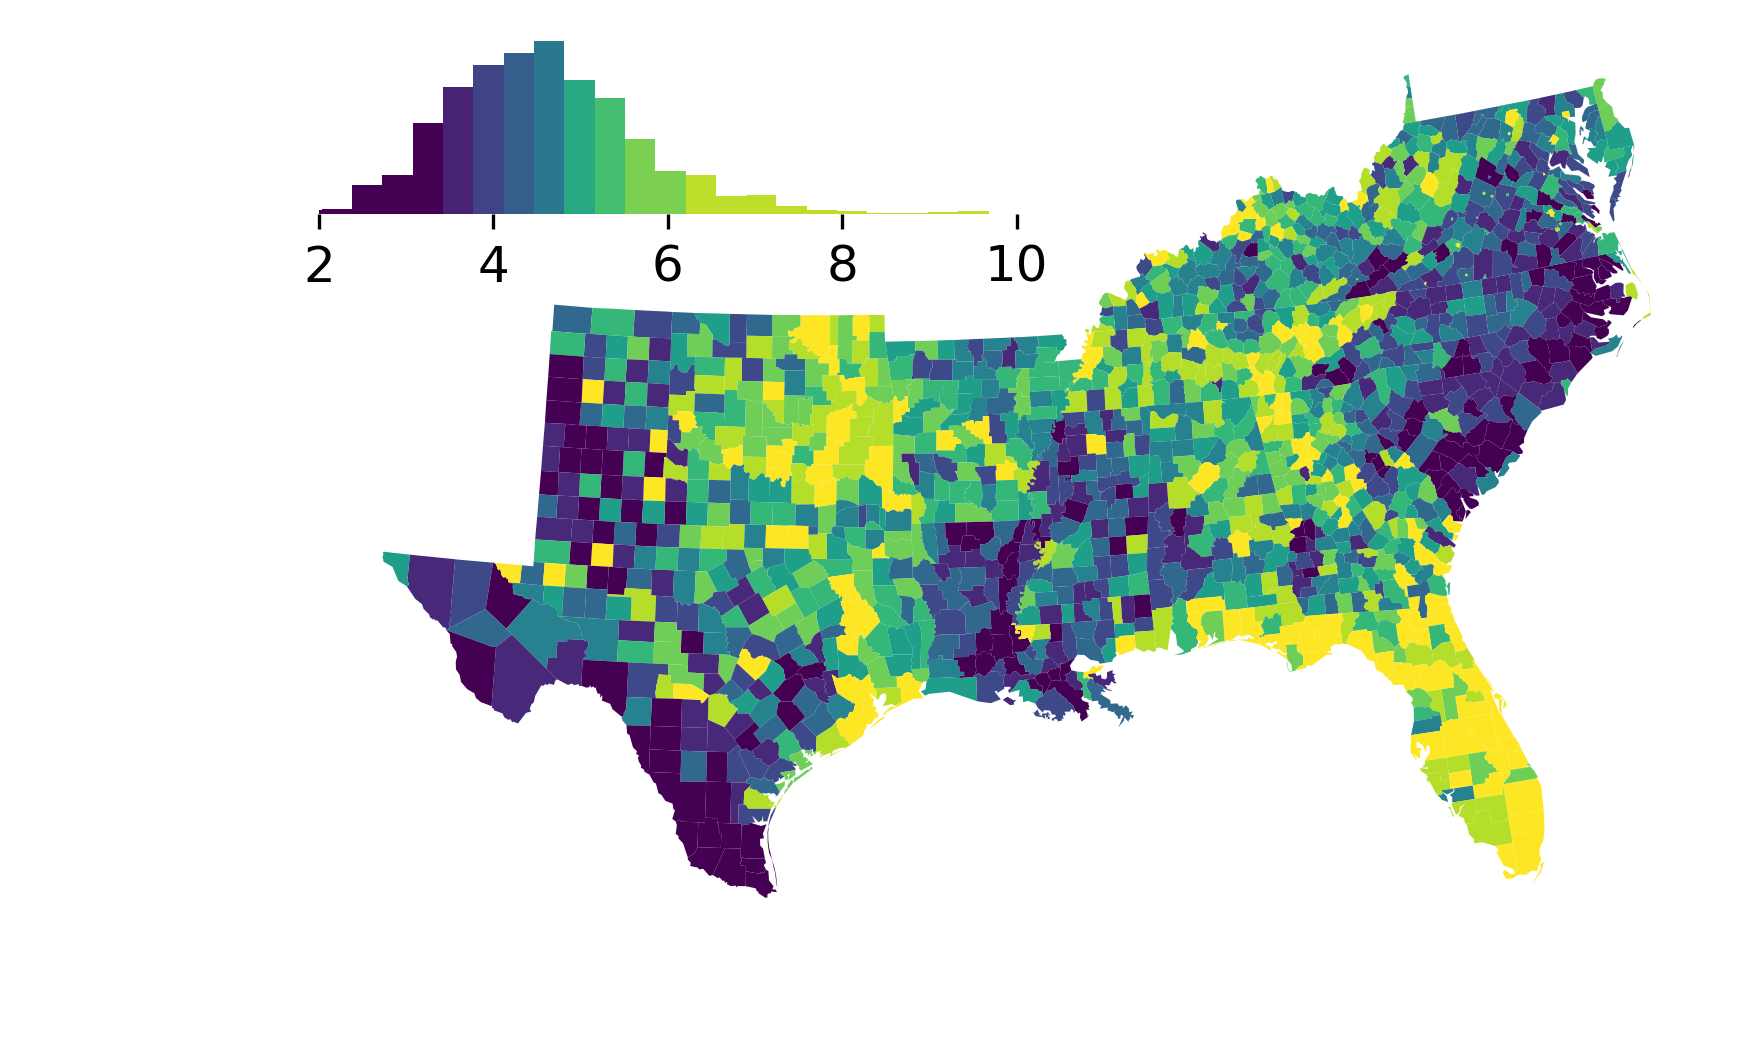
$ pip install legendgram然后,将函数应用于您想要legendgram的图形/坐标轴
>>> import pysal as ps, geopandas as gpd, matplotlib.pyplot as plt
>>> from legendgram import legendgram
>>> data = gpd.read_file(ps.examples.get_path('south.shp'))
>>> data.crs = {'init': 'epgs:4269'}
>>> data.to_crs(epsg=5070)
>>> f,ax = plt.subplots()
>>> data.plot('DV80', k=10, ax=ax, scheme='Quantiles')
>>> bins = ps.Quantiles(data['DV80'].values, k=10).bins
>>> from legendgram import legendgram
>>> import palettable.matplotlib as palmpl
>>> legendgram(f,ax,data['DV80'],bins,pal=palmpl.Viridis_10,
               legend_size=(.5,.2), # legend size in fractions of the axis
               loc = 'upper left' # matplotlib-style legend locations
               clip = (2,10) # clip the displayed range of the histogram
               )
还提供了一个示例笔记本,在此提供。
许可证
此代码基于3-Clause BSD许可证。有关更多详细信息,请参阅许可证文件。


关闭
legendgram-0.0.3.tar.gz 的哈希值
| 算法 | 哈希摘要 | |
|---|---|---|
| SHA256 | 1345a2191323d38b210470177435c9292a21e5dd2449f327179e29413772a9fa |
|
| MD5 | 8cf2d1b71a31d7d20f54ac987ad1589c |
|
| BLAKE2b-256 | 561e28596cbe4bb73727ba59d1cf63f2ad69799a308840c6a3fd4d214111e26c |
关闭
legendgram-0.0.3-py2.py3-none-any.whl 的哈希值
| 算法 | 哈希摘要 | |
|---|---|---|
| SHA256 | 71932cabca43434c3667e4f0c66dcde139ae5dfcdff3863845980b6f1278b711 |
|
| MD5 | 4160ba6ddbf0de0777e899cf4a66415e |
|
| BLAKE2b-256 | 90298a03d693d26f6fc4476953c7a639f978836b47b49635447b80201b522c58 |