解析并可视化iostat输出

项目描述
iostat-tool
解析并可视化iostat输出
要求
- Matplotlib
- 仅支持Linux的iostat输出
iostat命令需要-t参数以获取时间戳,并建议使用-ymxt 1参数
$ man iostat
  -t  Print the time for each report displayed. The timestamp format may depend on the value of the S_TIME_FORMAT environment variable (see below).
如何安装
对于用户
$ pip install iostat-tool
对于开发者
创建venv以安装 iostat-tool。
$ mkdir venvs
$ python3 -m venv venvs/venv
$ source venvs/venv/bin/activate
(venv) $
从存储库中安装 iostat-tool 软件包。
(venv) $ git clone https://github.com/t2y/iostat-tool.git
(venv) $ cd iostat-tool
(venv) $ python setup.py develop
基础CLI选项
确认 iostat-cli 如下所示工作。
(venv) $ iostat-cli --help
usage: iostat-cli [-h] [--backend BACKEND] [--data DATA]
                  [--fig-output FIGOUTPUT] [--fig-size FIGSIZE]
                  [--output OUTPUT] [--disks DISKS [DISKS ...]]
                  [--since SINCE] [--until UNTIL] [-v] [--version]
                  {csv,monitor,plot} ...

positional arguments:
  {csv,monitor,plot}

optional arguments:
  -h, --help            show this help message and exit
  --backend BACKEND     set backend for matplotlib, use TkAgg to monitor in
                        the foreground
  --data DATA           set path to iostat output file
  --fig-output FIGOUTPUT
                        set path to save graph
  --fig-size FIGSIZE    set figure size
  --output OUTPUT       set path to save output of iostat
  --disks DISKS [DISKS ...]
                        set disk name in iostat
  --since SINCE         set since datetime, format: yyyymmddHHMISS
  --until UNTIL         set until datetime, format: yyyymmddHHMISS
  -v, --verbose         set verbose mode
  --version             show program version
子命令
csv
从iostat输出创建csv/tsv文件。
(venv) $ iostat-cli csv --help
usage: iostat-cli csv [-h] [--dialect {excel,excel-tab,unix}]
                      [--separator {comma,tab}]

optional arguments:
  -h, --help            show this help message and exit
  --dialect {excel,excel-tab,unix}
                        set dialect for csv writer, default is excel
  --separator {comma,tab}
                        set separator, default is comma
plot
从iostat输出创建由matplotlib渲染的图像文件。
(venv) $ iostat-cli plot --help
usage: iostat-cli plot [-h] [--plot-type {plotter,scatter}]
                       [--subplots {io_rqm,iops,io_transfer,%util,avgrq-sz,avgqu-sz,await,svctm} [{io_rqm,iops,io_transfer,%util,avgrq-sz,avgqu-sz,await,svctm} ...]]
                       [--vlines VLINES [VLINES ...]]

optional arguments:
  -h, --help            show this help message and exit
  --plot-type {plotter,scatter}
                        set plot type ("plotter" by default)
  --subplots {io_rqm,iops,io_transfer,%util,avgrq-sz,avgqu-sz,await,svctm} [{io_rqm,iops,io_transfer,%util,avgrq-sz,avgqu-sz,await,svctm} ...]
                        set subplots to show
  --vlines VLINES [VLINES ...]
                        set vertical line, format: yyyymmddHHMISS
  --x-datetime-format X_DATETIME_FORMAT
                        set datetime format for devices x-axis
  --title TITLE         set title for graph
  --without-cpu         don't plot CPU data
  --cpu-only            plot only CPU data
monitor
监控和记录 iostat 命令的输出。
(venv) $ iostat-cli monitor --help
usage: iostat-cli monitor [-h] [--iostat-args IOSTAT_ARGS]
                          [--max-queue-size MAX_QUEUE_SIZE]

optional arguments:
  -h, --help            show this help message and exit
  --iostat-args IOSTAT_ARGS
                        set arguments for iostat
  --max-queue-size MAX_QUEUE_SIZE
                        set queue size to read iostat output
如何使用
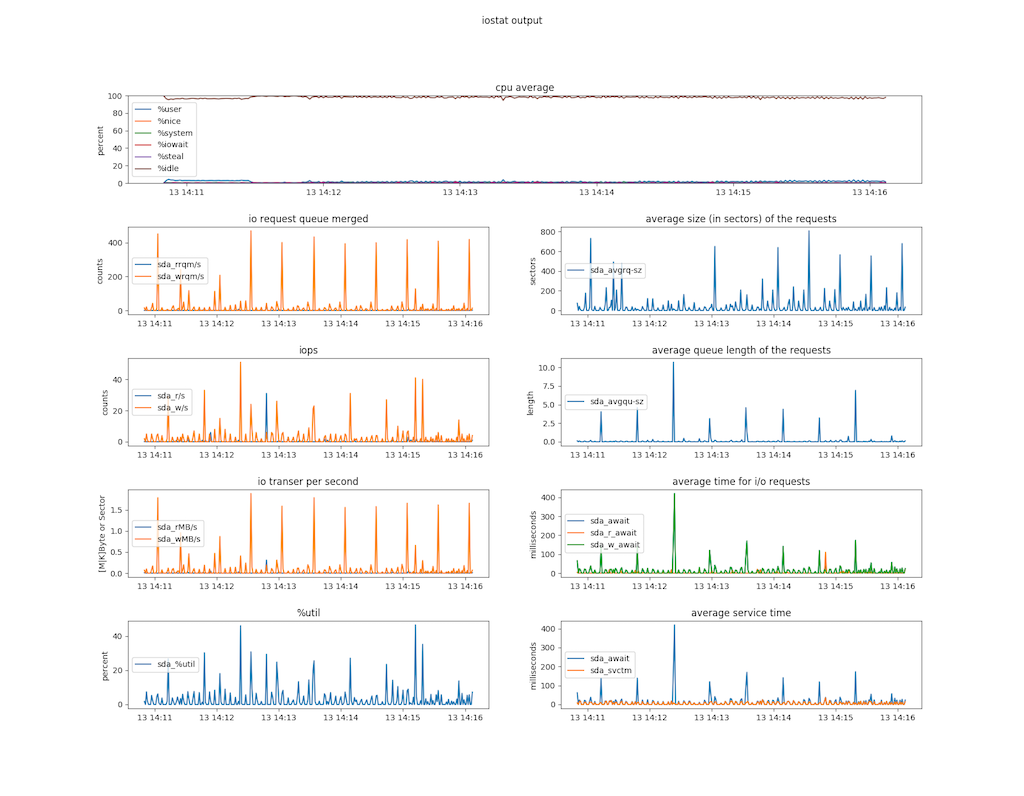
这是matplotlib渲染的示例图像。
已存在一个iostat.ouput作为数据文件
plot
- 显示 /dev/sda 和CPU平均值的所有子图
(venv) $ iostat-cli --data tests/fixtures/sample_iostat.output --disk sda --fig-output my-iostat.png plot
(venv) $ file my-iostat.png
my-iostat.png: PNG image data, 1800 x 1400, 8-bit/color RGBA, non-interlaced
- 显示 /dev/sda 和CPU平均值的所有子图
- 使用
--subplots过滤io_rqm和iops
- 使用
(venv) $ iostat-cli --data tests/fixtures/sample_iostat.output --disk sda --fig-output my-iostat.png \
  plot --subplots io_rqm iops
- 显示任何日期时间的范围
- 使用
--since过滤自2018-06-13 14:11:00开始 - 使用
--until过滤至2018-06-13 14:11:30
- 使用
(venv) $ iostat-cli --data tests/fixtures/sample_iostat.output --disk sda --fig-output my-iostat.png \
  --since 20180613141100 --until 20180613141130 plot --subplots await svctm
- 在图形中显示垂直线
- 使用
--vlines在2018-06-13 14:11:10和2018-06-13 14:11:20处显示垂直线
- 使用
(venv) $ iostat-cli --data tests/fixtures/sample_iostat.output --disk sda --fig-output my-iostat.png \
  --since 20180613141100 --until 20180613141130 plot --subplots await svctm --vlines 20180613141110 20180613141120
- 仅显示与CPU相关的数据
(venv) $ iostat-cli --data tests/fixtures/sample_iostat.output --disk sda --fig-output my-iostat.png \
  plot --cpu-only
- 仅显示一个子图,不包含CPU信息
(venv) $ iostat-cli --data tests/fixtures/sample_iostat.output --disk sda --fig-output my-iostat.png \
  plot --subplots await --without-cpu
- 使用自定义标题生成图形
(venv) $ iostat-cli --data tests/fixtures/sample_iostat.output --disk sda --fig-output my-iostat.png \
  plot --title 'my custom test'
csv
- 输出2个csv文件(iostat_cpu.csv和iostat_devices.csv)
(venv) $ iostat-cli --data tests/fixtures/sample_iostat.output --output iostat.csv csv
(venv) $ ls iostat_*.csv
iostat_cpu.csv		iostat_devices.csv
(venv) $ head -n 3 iostat_*.csv
==> iostat_cpu.csv <==
datetime,%user,%nice,%system,%iowait,%steal,%idle
2018-06-13 14:10:50,0.47,0.0,0.24,0.18,0.0,99.11
2018-06-13 14:10:51,3.07,0.0,0.66,0.09,0.0,96.18

==> iostat_devices.csv <==
datetime,device,rrqm/s,wrqm/s,r/s,w/s,rMB/s,wMB/s,avgrq-sz,avgqu-sz,await,r_await,w_await,svctm,%util
2018-06-13 14:10:50,sdd,0.07,45.88,1.57,0.59,0.08,0.18,246.55,0.26,121.04,1.28,436.94,2.07,0.45
2018-06-13 14:10:50,sdh,0.07,45.78,1.59,0.6,0.08,0.18,245.64,0.22,101.97,1.17,367.51,1.89,0.41
运行iostat并记录输出
- 监控iostat命令的运行
- 几乎与
iostat -yxmt 1 | tee my-iostat.log相同
- 几乎与
(venv) $ iostat-cli --output my-iostat.log --fig-output my-scatter.png monitor --iostat-args "-yxmt 1"
...
06/13/2018 10:11:07 PM
avg-cpu:  %user   %nice %system %iowait  %steal   %idle
           0.94    0.00    0.03    0.00    0.00   99.03

Device:         rrqm/s   wrqm/s     r/s     w/s    rMB/s    wMB/s avgrq-sz avgqu-sz   await r_await w_await  svctm  %util
sda               0.00     0.00    0.00    0.00     0.00     0.00     0.00     0.00    0.00    0.00    0.00   0.00   0.00

06/18/2018 10:11:08 PM
avg-cpu:  %user   %nice %system %iowait  %steal   %idle
           0.16    0.00    0.06    0.00    0.00   99.78
...

(Ctrl + C) # stop to run iostat
(venv) $ file my-iostat.log my-scatter.png
my-iostat.log:  ASCII text
my-scatter.png: PNG image data, 1800 x 1300, 8-bit/color RGBA, non-interlaced
注意:当io-stat终止时,保存my-scatter.png是实验性功能,因此可能无法保存图像。


关闭
iostat-tool-0.3.1.tar.gz的哈希值
| 算法 | 哈希摘要 | |
|---|---|---|
| SHA256 | 6168387d05ab8c20f17a9ed9994052e83481a24c8c819d447813dfba4a96b6ed |
|
| MD5 | ef0ff6747a4a55749ff8cd27738a034e |
|
| BLAKE2b-256 | c0f449ad4df5ea3d2860ff68dbd5f497d2a72654c3f67dacf8969492e31666c1 |