解析和可视化iosnoop输出

项目描述
iosnoop-tool
解析和可视化iosnoop输出
什么是iosnoop?
iosnoop 是一个用于跟踪磁盘I/O事件的工具,由 Brendan D. Gregg 创建。最初,它是为 Solaris/MacOS X 使用 DTrace 而设计的。
iosnoop - 一个打印磁盘I/O事件的程序,包含有用的细节,如UID、PID、文件名(如果可用)、命令等。使用 DTrace(Solaris 10 3/05,MacOS X 10.5)编写。
然后,iosnoop 被移植到Linux,使用了 ftrace。请参阅他的博客以了解iosnoop的详细信息。
我可能是在做梦。我只是将我流行的iosnoop工具移植到了Linux
http://www.brendangregg.com/blog/2014-07-16/iosnoop-for-linux.html
Linux移植的iosnoop是一个简单的bash脚本,可以在此处下载。
输出如下。iosnoop运行需要root权限。iosnoop使用1行总结了块设备I/O(磁盘I/O)的延迟(LATms)。
$ sudo path/to/iosnoop -ts
Tracing block I/O. Ctrl-C to end.
STARTs          ENDs            COMM         PID    TYPE DEV      BLOCK        BYTES     LATms
14545946.332115 14545946.344366 <...>        17185  WS   8,160    4840587442   4096      12.25
14545946.331036 14545946.347082 main         17197  WS   8,160    4840666914   4096      16.05
14545946.332136 14545946.348852 <...>        17185  WS   8,160    4840643666   4096      16.72
14545946.331067 14545946.352752 main         17197  WS   8,160    4844855458   4096      21.69
14545946.332146 14545946.355893 <...>        17185  WS   8,160    4844863762   4096      23.75
14545946.356584 14545946.358920 <idle>       0      WS   8,160    4844859722   4096       2.34
14545946.356238 14545946.361128 <idle>       0      WS   8,160    4844855466   4096       4.89
14545946.356943 14545946.364070 <idle>       0      WS   8,160    4844863770   4096       7.13
为什么需要iosnoop-tool?
iosnoop-tool 是一个用于可视化iosnoop输出的工具。
Brendan还提供了一个名为 trace2heatmap.pl 的可视化工具,并介绍了如何从iosnoop输出创建热图。
我已确认此工具可以正常工作,并知道热图看起来已经足够好。然而,我不擅长阅读/编写perl脚本,因此我创建了用于定制我目的的我的可视化工具。
要求
- Python >= 3.4
- Seaborn
- 仅支持Linux的iosnoop输出
- 需要
-ts参数
- 需要
$ sudo iosnoop -ts
如何安装
针对开发者
创建virtualenv来安装iosnoop-tool。
$ mkdir virtualenvs
$ virtualenv -p python3 virtualenvs/venv
$ source virtualenvs/venv/bin/activate
(venv) $
从仓库中安装iosnoop-tool包。
(venv) $ git clone https://github.com/t2y/iosnoop-tool.git
(venv) $ cd iosnoop-tool
(venv) $ python setup.py develop
基本CLI选项
确认iosnoop-cli按以下方式工作。
(venv) $ iosnoop-cli --help
usage: iosnoop-cli [-h] [--basedate BASEDATE] --data DATA
                   [--columns COLUMNS [COLUMNS ...]]
                   [--io-commands IO_COMMANDS [IO_COMMANDS ...]]
                   [--io-device IO_DEVICE] [--io-pids IO_PIDS [IO_PIDS ...]]
                   [--io-types IO_TYPES [IO_TYPES ...]] [--since SINCE]
                   [--until UNTIL] [-v] [--version]
                   {csv,plot} ...

positional arguments:
  {csv,plot}

optional arguments:
  -h, --help            show this help message and exit
  --basedate BASEDATE   set base datetime to convert kernel timestamp to
                        localtime, format: yyyymmddHHMISS
  --data DATA           set path to iosnoop output file
  --columns COLUMNS [COLUMNS ...]
                        set columns name in iosnoop output
  --io-commands IO_COMMANDS [IO_COMMANDS ...]
                        set commands in iosnoop output
  --io-device IO_DEVICE
                        set device in iosnoop output
  --io-pids IO_PIDS [IO_PIDS ...]
                        set process ids in iosnoop output
  --io-types IO_TYPES [IO_TYPES ...]
                        set types in iosnoop output
  --since SINCE         set seconds since relative difference from start
  --until UNTIL         set seconds until relative difference from start
  -v, --verbose         set verbose mode
  --version             show program version
子命令
csv
从iosnoop输出创建csv/tsv文件。
(venv) $ iosnoop-cli csv --help
usage: iosnoop-cli csv [-h] [--dialect {excel,excel-tab,unix}]
                       [--output OUTPUT] [--separator SEPARATOR]

optional arguments:
  -h, --help            show this help message and exit
  --dialect {excel,excel-tab,unix}
                        set dialect for csv writer, default is excel
  --output OUTPUT       set path to save csv file of iosnoop
  --separator SEPARATOR
                        set separator (choose from comma, tab), default is comma
plot
从iosnoop输出创建由seaborn渲染的图像文件。
(venv) $ iosnoop-cli plot --help
usage: iosnoop-cli plot [-h] [--backend BACKEND] [--colormap COLORMAP]
                        [--fig-output FIGOUTPUT] [--fig-size FIGSIZE]
                        [--hspace HSPACE] [--plot-type {heatmap}] [--square]
                        [--subplot-conditions SUBPLOT_CONDITIONS [SUBPLOT_CONDITIONS ...]]
                        [--x-interval X_INTERVAL] [--x-max X_MAX]
                        [--y-interval Y_INTERVAL] [--y-max Y_MAX]

optional arguments:
  -h, --help            show this help message and exit
  --backend BACKEND     set backend for matplotlib, use TkAgg to monitor in
                        the foreground
  --colormap COLORMAP   set color map for seaborn heatmap
  --fig-output FIGOUTPUT
                        set path to save graph
  --fig-size FIGSIZE    set figure size
  --hspace HSPACE       set hspace for subplot
  --plot-type {heatmap}
                        set plot type ("heatmap" by default)
  --square              set square mode for heatmap
  --subplot-conditions SUBPLOT_CONDITIONS [SUBPLOT_CONDITIONS ...]
                        set DataFrame conditions to filter
  --x-interval X_INTERVAL
                        set value of interval for x bins
  --x-max X_MAX         set maximum value for x-axis
  --y-interval Y_INTERVAL
                        set value of interval for y bins
  --y-max Y_MAX         set maximum value for y-axis
如何使用
这是由seaborn渲染的示例热图。
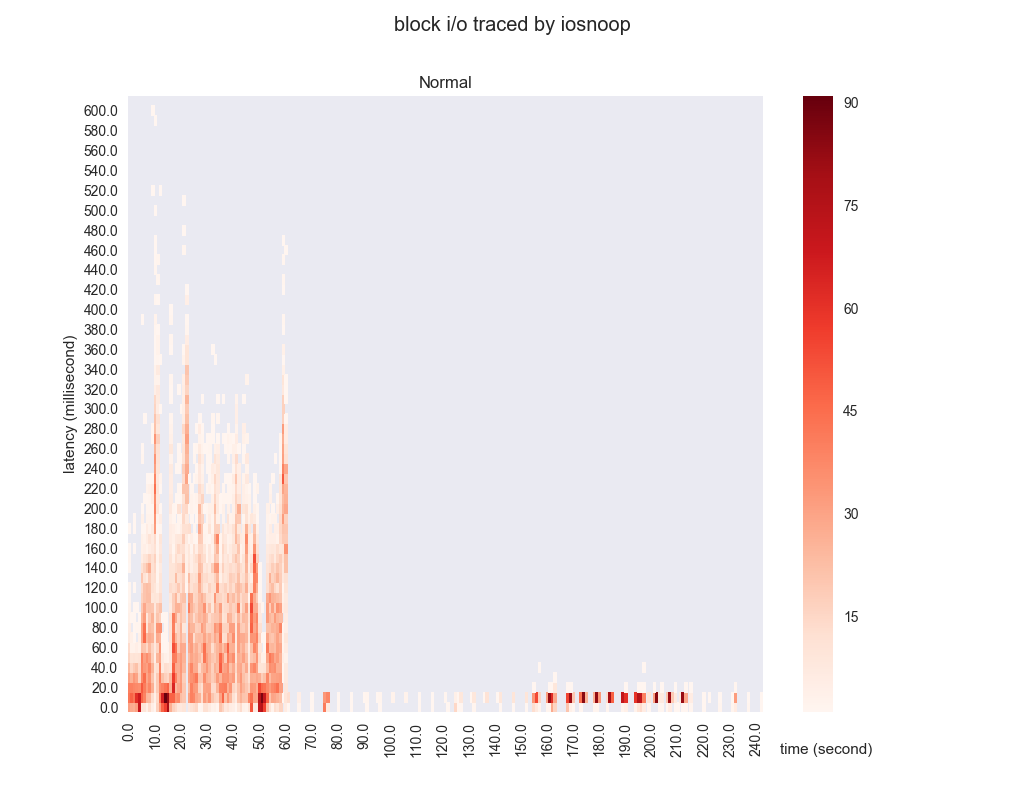
(venv) $ iosnoop-cli --data tests/fixtures/iosnoop-sample.log plot --y-max 600 --y-interval 10 --fig-output tests/fixtures/iosnoop-sample.png
...
(venv) $ file tests/fixtures/iosnoop-sample.png
tests/fixtures/iosnoop-sample.png: PNG image data, 1024 x 800, 8-bit/color RGBA, non-interlaced
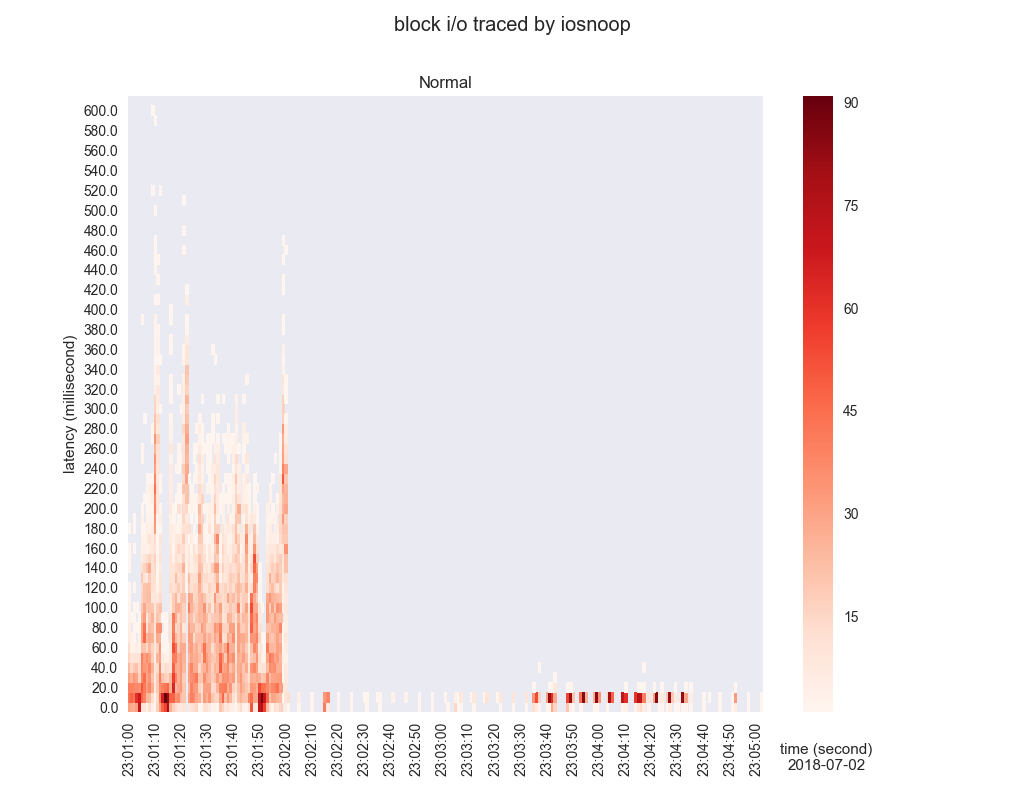
指定--basedate选项将内核时间戳转换为本地时间。
(vent) $ iosnoop-cli --basedate 20180702230100 --data tests/fixtures/iosnoop-sample.log plot --y-max 600 --y-interval 10 --fig-output tests/fixtures/iosnoop-sample-with-basedate.png
示例
plot
- 显示图形窗口而不是保存图像文件
(venv) $ iosnoop-cli --data tests/fixtures/iosnoop-sample.log plot --backend TkAgg
- 根据需要调整x轴和y轴,默认设置可能不合适,取决于iosnoop的输出
(venv) $ iosnoop-cli --data tests/fixtures/iosnoop-sample.log plot --x-max 100 --x-interval 2.0 --y-max 300 --y-interval 5
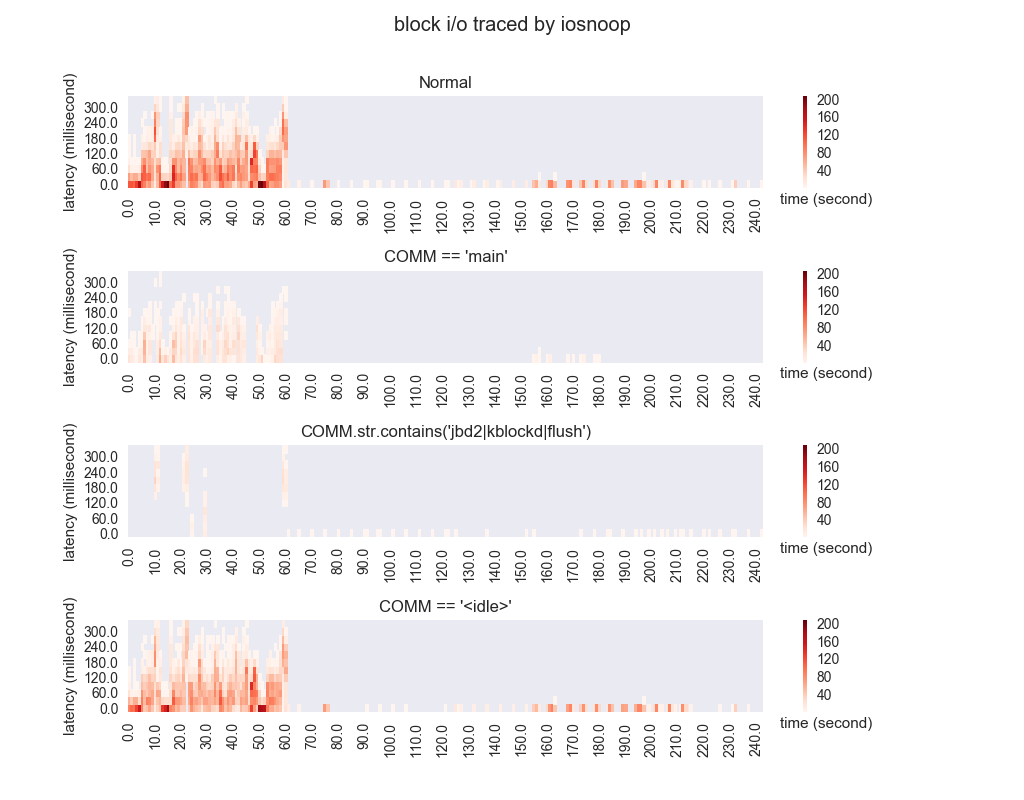
比较多个子图
使用表头名称从pandas.DataFrame检索特定数据。
(venv) $ head tests/fixtures/iosnoop-sample.log
STARTs          ENDs            COMM         PID    TYPE DEV      BLOCK        BYTES     LATms
14545946.332115 14545946.344366 <...>        17185  WS   8,160    4840587442   4096      12.25
14545946.331036 14545946.347082 main         17197  WS   8,160    4840666914   4096      16.05
14545946.356943 14545946.364070 <idle>       0      WS   8,160    4844863770   4096       7.13
- 通过精确匹配和包含字符串检索,使用--hspace调整每个子图的高度空间
(venv) $ iosnoop-cli --data tests/fixtures/iosnoop-sample.log plot --y-max 300 --y-interval 30 --subplot-conditions "COMM == 'main'" "COMM.str.contains('jbd2|kblockd|flush')" "COMM == '<idle>'" --hspace 0.9 --fig-output tests/fixtures/iosnoop-sample-comm.png
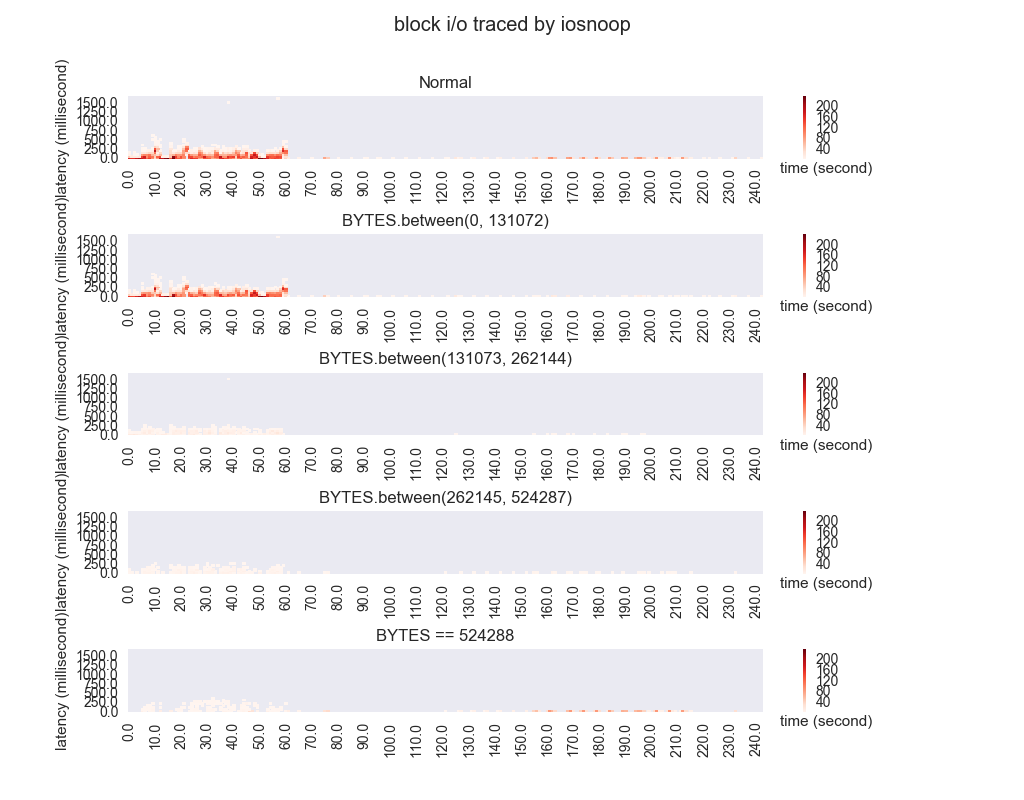
- 通过字节数之间检索,使用--hspace调整每个子图的高度空间
(venv) $ iosnoop-cli --data tests/fixtures/iosnoop-sample.log plot --subplot-conditions "BYTES.between(0, 131072)" "BYTES.between(131073, 262144)" "BYTES.between(262145, 524287)" "BYTES == 524288" --hspace 1.2 --fig-output tests/fixtures/iosnoop-sample-bytes.png
csv
- 将解析自iosnoop输出的内容写入csv文件
(venv) $ iosnoop-cli --data tests/fixtures/iosnoop-sample.log csv --output iosnoop.csv
(venv) $ head iosnoop.csv
STARTs,ENDs,COMM,PID,TYPE,DEV,BLOCK,BYTES,LATms,STARTs_DIFF
14545946.332115,14545946.344366,<...>,17185,WS,"8,160",4840587442,4096,12.25,0
14545946.331036,14545946.347082,main,17197,WS,"8,160",4840666914,4096,16.05,-0.0010790005326271057
14545946.332136,14545946.348852,<...>,17185,WS,"8,160",4840643666,4096,16.72,2.099946141242981e-05

iosnoop-tool-0.1.0.tar.gz的哈希值
| 算法 | 哈希摘要 | |
|---|---|---|
| SHA256 | eb039f3f5a63e364fda9ea0f5c059cbfdd7519fd69c27b80a110645914757dfd |
|
| MD5 | ca44b81909448fd7672367edad52aad5 |
|
| BLAKE2b-256 | 761e39de440bde8ef3f48b766411515e90a71bd34077c0c1852961f3f3933e15 |