高维交互式绘图工具

项目描述
HiPlot - 高维交互式绘图 


HiPlot是一个轻量级的交互式可视化工具,帮助AI研究人员使用并行图和其他图形方式来发现高维数据中的相关性模式和规律。
现在用sweep数据试一试或上传您的CSV或
HiPlot有几种模式
- 作为一个Web服务器(如果你的数据是CSV等)
- 在一个jupyter笔记本中(用于可视化Python数据),或在Streamlit应用中
- 在CLI中渲染独立的HTML
pip install -U hiplot # Or for conda users: conda install -c conda-forge hiplot
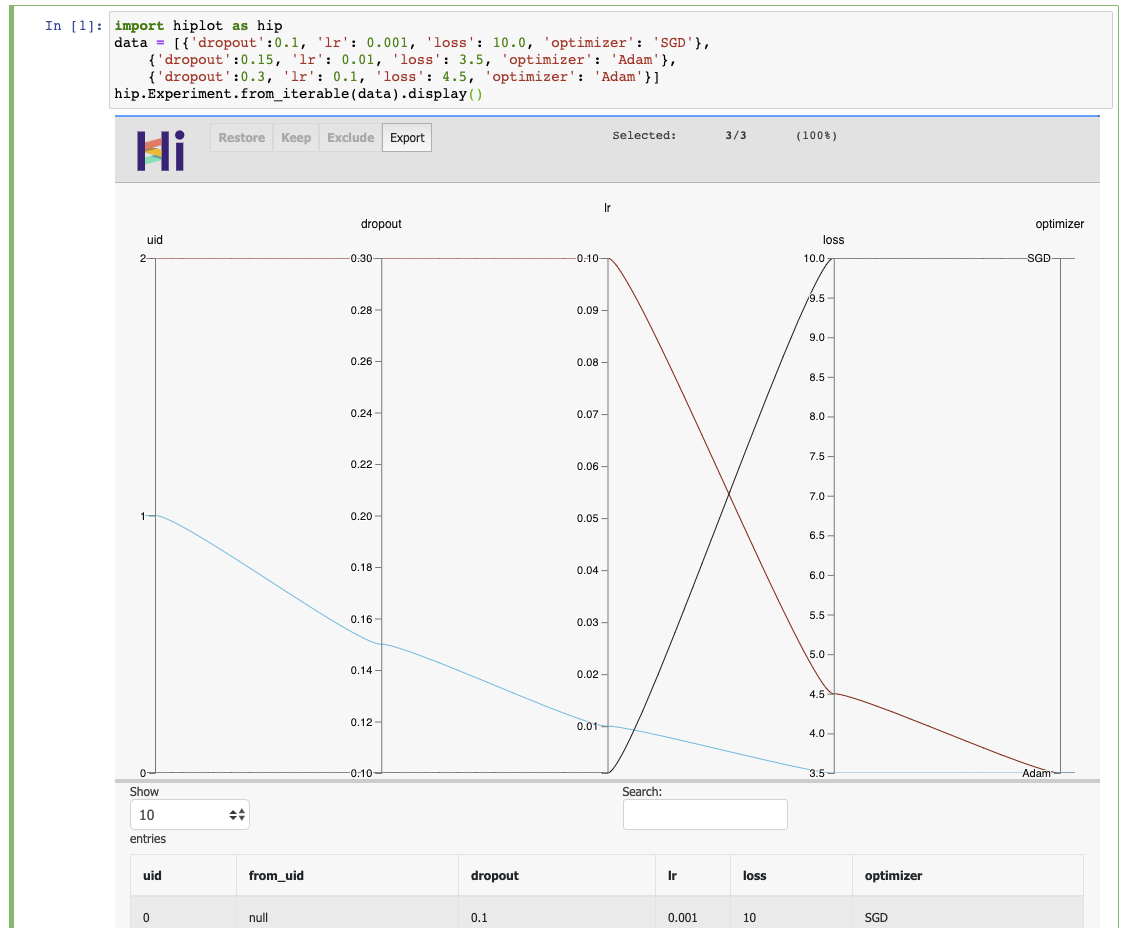
如果你有一个jupyter笔记本,你可以从以下简单的步骤开始
import hiplot as hip
data = [{'dropout':0.1, 'lr': 0.001, 'loss': 10.0, 'optimizer': 'SGD'},
        {'dropout':0.15, 'lr': 0.01, 'loss': 3.5, 'optimizer': 'Adam'},
        {'dropout':0.3, 'lr': 0.1, 'loss': 4.5, 'optimizer': 'Adam'}]
hip.Experiment.from_iterable(data).display()
查看实时结果
链接
- 博客文章:https://ai.facebook.com/blog/hiplot-high-dimensional-interactive-plots-made-easy/
- 文档:https://facebookresearch.github.io/hiplot/index.html
- Pypi软件包:https://pypi.ac.cn/project/hiplot/
- Conda软件包:https://anaconda.org/conda-forge/hiplot
- NPM软件包:https://npmjs.net.cn/package/hiplot
- 示例:https://github.com/facebookresearch/hiplot/tree/master/examples
引用
@misc{hiplot,
    author = {Haziza, D. and Rapin, J. and Synnaeve, G.},
    title = {{Hiplot, interactive high-dimensionality plots}},
    year = {2020},
    publisher = {GitHub},
    journal = {GitHub repository},
    howpublished = {\url{https://github.com/facebookresearch/hiplot}},
}
致谢
灵感来源于并基于来自 Kai Chang、Mike Bostock 和 Jason Davies 的代码。
外部贡献者(请在提交第一个pull请求时添加您的姓名)
许可证


关闭
hiplot-master-0.1.22.113.tar.gz的哈希值
| 算法 | 哈希摘要 | |
|---|---|---|
| SHA256 | a2e6d72c1e82704383a4d3d7f80fbdd382e05f012f9cd80339c1b019545c4d80 |
|
| MD5 | f60c575c10764c69b0a93490c1f54470 |
|
| BLAKE2b-256 | a4043503488e7a6be26c67bfb031526074ac4f864c60922cea333dc14523f0dc |