guiqwt 4.3.1
pip install guiqwt==4.3.1
Released:
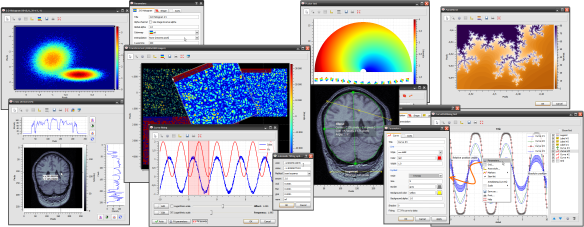
guiqwt is a set of tools for curve and image plotting (extension to PythonQwt)
Navigation

Unverified details
These details have not been verified by PyPIProject links
Meta
- License: CeCILL V2
- Author: Pierre Raybaut
Classifiers
- Operating System
- Programming Language
- Topic
Project description
See documentation for more details on the library and changelog for recent history of changes.
Copyright © 2009-2020 CEA, Pierre Raybaut, licensed under the terms of the CECILL License.
Overview
Based on PythonQwt (a pure Python/PyQt reimplementation of the curve plotting Qwt C++ library, included in guiqwt base source code) and on the scientific modules NumPy and SciPy, guiqwt is a Python library providing efficient 2D data-plotting features (curve/image visualization and related tools) for interactive computing and signal/image processing application development. It is based on Qt graphical user interfaces library, and currently supports both PyQt5 and PySide2.
Extension to PythonQwt:
set of tools for curve and image plotting
GUI-based application development helpers
Building, installation, …
The following packages are required: PyQt5, PythonQwt, guidata, NumPy, SciPy and Pillow.
See the README and documentation for more details.
Project details
Unverified details
These details have not been verified by PyPIProject links
Meta
- License: CeCILL V2
- Author: Pierre Raybaut
Classifiers
- Operating System
- Programming Language
- Topic
Release history Release notifications | RSS feed


Download files
Download the file for your platform. If you're not sure which to choose, learn more about installing packages.
Source Distribution
Built Distributions
Filter files by name, interpreter, ABI, and platform.
If you're not sure about the file name format, learn more about wheel file names.
Copy a direct link to the current filters https://pypi.org/project/guiqwt/4.3.1/#files
Showing 9 of 9 files.
File details
Details for the file guiqwt-4.3.1.tar.gz.
File metadata
- Download URL: guiqwt-4.3.1.tar.gz
- Upload date:
- Size: 3.3 MB
- Tags: Source
- Uploaded using Trusted Publishing? No
- Uploaded via: twine/3.5.0 importlib_metadata/4.8.0 pkginfo/1.7.1 requests/2.26.0 requests-toolbelt/0.9.1 tqdm/4.62.3 CPython/3.10.0
File hashes
| Algorithm | Hash digest | |
|---|---|---|
| SHA256 |
bb84519e1f7b2eadeae0a41257211e79882eece4be2198028c81cc7a51597bfb
|
|
| MD5 |
24810901331cb145c59ee7afc1b19dc1
|
|
| BLAKE2b-256 |
d6a6139f7314f7456383974d65a17855513b71f3772800b8ef1817c19f8b463a
|
File details
Details for the file guiqwt-4.3.1-cp311-cp311-win_amd64.whl.
File metadata
- Download URL: guiqwt-4.3.1-cp311-cp311-win_amd64.whl
- Upload date:
- Size: 754.1 kB
- Tags: CPython 3.11, Windows x86-64
- Uploaded using Trusted Publishing? No
- Uploaded via: twine/4.0.1 CPython/3.11.0
File hashes
| Algorithm | Hash digest | |
|---|---|---|
| SHA256 |
0ce013e55fa3cf91dd70c9972bdef9298c1fce652d59d6495312a8939c26fad8
|
|
| MD5 |
bb74878fe68eb485b02e9f895f8040de
|
|
| BLAKE2b-256 |
a2420db67856d30f6de0fbe4e672624c81a925027976fb5956cf5684b7e36beb
|
File details
Details for the file guiqwt-4.3.1-cp310-cp310-win_amd64.whl.
File metadata
- Download URL: guiqwt-4.3.1-cp310-cp310-win_amd64.whl
- Upload date:
- Size: 3.6 MB
- Tags: CPython 3.10, Windows x86-64
- Uploaded using Trusted Publishing? No
- Uploaded via: twine/3.5.0 importlib_metadata/4.8.0 pkginfo/1.7.1 requests/2.26.0 requests-toolbelt/0.9.1 tqdm/4.62.3 CPython/3.10.0
File hashes
| Algorithm | Hash digest | |
|---|---|---|
| SHA256 |
5ef90dd2eac4193ad9ab4e484077127c61c0795771b91c0d90e900374543a86f
|
|
| MD5 |
07c6fbd24a88de4d3adebb2ecc22c7b9
|
|
| BLAKE2b-256 |
c5142529fa1404bb88fecfeff2b99acf248996f278e1fe46c0883e799b8bb5f0
|
File details
Details for the file guiqwt-4.3.1-cp310-cp310-win32.whl.
File metadata
- Download URL: guiqwt-4.3.1-cp310-cp310-win32.whl
- Upload date:
- Size: 4.3 MB
- Tags: CPython 3.10, Windows x86
- Uploaded using Trusted Publishing? No
- Uploaded via: twine/3.5.0 importlib_metadata/4.8.0 pkginfo/1.7.1 requests/2.26.0 requests-toolbelt/0.9.1 tqdm/4.62.3 CPython/3.10.0
File hashes
| Algorithm | Hash digest | |
|---|---|---|
| SHA256 |
dd669f264be8662396a33296c995cf95d03b946512de0635d43222de7e97f4ac
|
|
| MD5 |
cde34d22363f30fc62c1290f5a7bed44
|
|
| BLAKE2b-256 |
b0e01e9f6db0153b9ef44a33dbf681231cb965c02ac546834f6f40372a0a2c25
|
File details
Details for the file guiqwt-4.3.1-cp39-cp39-win_amd64.whl.
File metadata
- Download URL: guiqwt-4.3.1-cp39-cp39-win_amd64.whl
- Upload date:
- Size: 4.3 MB
- Tags: CPython 3.9, Windows x86-64
- Uploaded using Trusted Publishing? No
- Uploaded via: twine/3.5.0 importlib_metadata/4.8.0 pkginfo/1.7.1 requests/2.26.0 requests-toolbelt/0.9.1 tqdm/4.62.3 CPython/3.10.0
File hashes
| Algorithm | Hash digest | |
|---|---|---|
| SHA256 |
3bfd8ea0b70967f7888c6908ac9bf40e6d927d8c174b4be1e8e968eaf708695a
|
|
| MD5 |
a422854e9f96a5f4abd162a0e6ea0a16
|
|
| BLAKE2b-256 |
75dba51d19a4f5efc9deb1c69bbbdf9063730f22b4caed01e5707eb21b839a95
|
File details
Details for the file guiqwt-4.3.1-cp39-cp39-win32.whl.
File metadata
- Download URL: guiqwt-4.3.1-cp39-cp39-win32.whl
- Upload date:
- Size: 4.3 MB
- Tags: CPython 3.9, Windows x86
- Uploaded using Trusted Publishing? No
- Uploaded via: twine/3.5.0 importlib_metadata/4.8.0 pkginfo/1.7.1 requests/2.26.0 requests-toolbelt/0.9.1 tqdm/4.62.3 CPython/3.10.0
File hashes
| Algorithm | Hash digest | |
|---|---|---|
| SHA256 |
84cd2dec266e73fd2687d9be96c7bf63c399d02bce9043ef3aa604b3af0cb2a2
|
|
| MD5 |
ce6767734a9d928bf095e217c5638e99
|
|
| BLAKE2b-256 |
7bc79f862a88370ab8563818e1f3ac44308968831b0053370ffd905c2fd18e71
|
File details
Details for the file guiqwt-4.3.1-cp38-cp38-win_amd64.whl.
File metadata
- Download URL: guiqwt-4.3.1-cp38-cp38-win_amd64.whl
- Upload date:
- Size: 4.2 MB
- Tags: CPython 3.8, Windows x86-64
- Uploaded using Trusted Publishing? No
- Uploaded via: twine/3.5.0 importlib_metadata/4.8.0 pkginfo/1.7.1 requests/2.26.0 requests-toolbelt/0.9.1 tqdm/4.62.3 CPython/3.10.0
File hashes
| Algorithm | Hash digest | |
|---|---|---|
| SHA256 |
18e58679cfbfca26e74f4d47a507c057284420e097f218447d7a0d8c1909b921
|
|
| MD5 |
f69f1dadeeced4015e8ff191f88a70d4
|
|
| BLAKE2b-256 |
9e3967a803f05c854bcab6ae4ccef5356e40080967edaadbe2c8af28fbc3262a
|
File details
Details for the file guiqwt-4.3.1-cp38-cp38-win32.whl.
File metadata
- Download URL: guiqwt-4.3.1-cp38-cp38-win32.whl
- Upload date:
- Size: 4.3 MB
- Tags: CPython 3.8, Windows x86
- Uploaded using Trusted Publishing? No
- Uploaded via: twine/3.5.0 importlib_metadata/4.8.0 pkginfo/1.7.1 requests/2.26.0 requests-toolbelt/0.9.1 tqdm/4.62.3 CPython/3.10.0
File hashes
| Algorithm | Hash digest | |
|---|---|---|
| SHA256 |
616be822a116a09f07f2810b31db368efccc9a32411137cd3be87bb9b68d0cfb
|
|
| MD5 |
37024295d930791790e0bbc46f0542ce
|
|
| BLAKE2b-256 |
1b10aab275c87b01138062ab1d281fffc6ef615ff4c13d987e4cd45b4644f565
|
File details
Details for the file guiqwt-4.3.1-cp37-cp37m-win_amd64.whl.
File metadata
- Download URL: guiqwt-4.3.1-cp37-cp37m-win_amd64.whl
- Upload date:
- Size: 4.3 MB
- Tags: CPython 3.7m, Windows x86-64
- Uploaded using Trusted Publishing? No
- Uploaded via: twine/3.5.0 importlib_metadata/4.8.0 pkginfo/1.7.1 requests/2.26.0 requests-toolbelt/0.9.1 tqdm/4.62.3 CPython/3.10.0
File hashes
| Algorithm | Hash digest | |
|---|---|---|
| SHA256 |
cb473e7e14fdee34b5c2762a791231c9142b70a7a14a5fec5a5c66172f1f3b5c
|
|
| MD5 |
ebac76c9bd2b22d33202d9a2ab1033b9
|
|
| BLAKE2b-256 |
f59c6517b5d80fdee17d87db684b6c8c2d5ab6f33d2a8847064cd6a98bc61d67
|
File details
Details for the file guiqwt-4.3.1-cp37-cp37m-win32.whl.
File metadata
- Download URL: guiqwt-4.3.1-cp37-cp37m-win32.whl
- Upload date:
- Size: 4.3 MB
- Tags: CPython 3.7m, Windows x86
- Uploaded using Trusted Publishing? No
- Uploaded via: twine/3.5.0 importlib_metadata/4.8.0 pkginfo/1.7.1 requests/2.26.0 requests-toolbelt/0.9.1 tqdm/4.62.3 CPython/3.10.0
File hashes
| Algorithm | Hash digest | |
|---|---|---|
| SHA256 |
54b48bf645b0fc4319a07b9de0cfcaa8ab1d6959ada6fc6c8ee481beb82ff024
|
|
| MD5 |
22056aede75c9be4ecbfb5dd9a7188be
|
|
| BLAKE2b-256 |
b0a62a6e9f66bb17069642fea4cfe9fc4237b983e8a902b74236d2f048af31b4
|


