在Grafana实体中按照git-wtf的精神进行grep搜索

项目描述


关于
grafana-wtf - 按照git-wtf的精神在Grafana实体中进行grep搜索。
概要
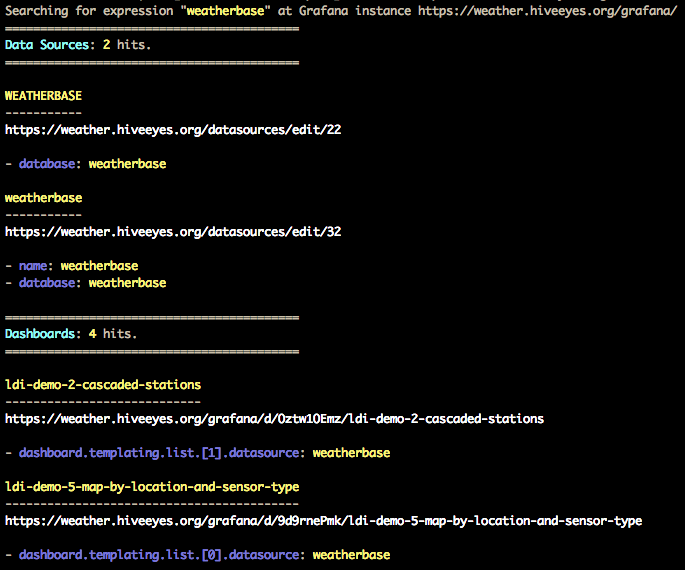
搜索Grafana(仪表板和数据源)中的字符串“weatherbase”。
grafana-wtf find weatherbase
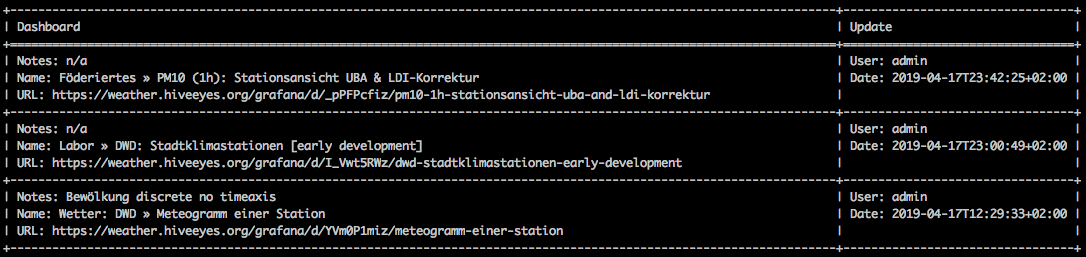
显示所有仪表板中最新的50个更改。
grafana-wtf log --number=50
更详细地探索仪表板和数据源。
grafana-wtf explore dashboards
grafana-wtf explore datasources
探索插件。
grafana-wtf plugins list
grafana-wtf plugins status
使用Docker运行
# Access Grafana instance on localhost, without authentication.
docker run --rm -it \
    --env GRAFANA_URL="http://host.docker.internal:3000" \
    ghcr.io/grafana-toolbox/grafana-wtf grafana-wtf info

# Access Grafana instance with authentication.
docker run --rm -it \
    --env GRAFANA_URL="https://grafana.example.org/grafana" \
    --env GRAFANA_TOKEN="eyJrIjoiWHg...dGJpZCI6MX0=" \
    ghcr.io/grafana-toolbox/grafana-wtf grafana-wtf info
屏幕截图
grafana-wtf 查找
grafana-wtf 记录
设置
安装 grafana-wtf
pip install grafana-wtf
配置 Grafana
请按照以下步骤在您的 Grafana 实例中创建 API 密钥
访问 https://daq.example.org/grafana/org/apikeys。
选择“新建 API 密钥”。
密钥名称:grafana-wtf
角色:管理员
从输出 curl -H "Authorization: Bearer eyJrIjoiWHg...dGJpZCI6MX0=" ... 中,请记下 Bearer 令牌。这是您的 Grafana API 密钥。
配置
Grafana 连接
要配置连接到哪个 Grafana 实例以及如何进行身份验证,请使用 --grafana-url 和 --grafana-token 命令行选项。
或者,在运行 grafana-wtf 之前,您可以使用环境变量定义您的 Grafana 实例的 URL 和访问令牌。
export GRAFANA_URL=https://daq.example.org/grafana/
export GRAFANA_TOKEN=eyJrIjoiWHg...dGJpZCI6MX0=
为了接受不受信任的 SSL 证书,请将查询字符串 ?verify=no 添加到 GRAFANA_URL
export GRAFANA_URL=https://daq.example.org/grafana/?verify=no
缓存
默认情况下,grafana-wtf 将缓存 HTTP 响应 60 分钟,以节省资源,避免每次都击中服务器。您可以使用 --cache-ttl 选项或 CACHE_TTL 环境变量来配置此设置。
使用 --drop-cache 选项调用程序时,它将立即删除其缓存。
用法
一般信息
# Display a bunch of meta information and statistics.
grafana-wtf info --format=yaml

# Display Grafana version.
grafana-wtf info --format=json | jq -r '.grafana.version'
探索数据源
如何找到未使用的数据源?
# Display all data sources and the dashboards using them, as well as unused data sources.
grafana-wtf explore datasources --format=yaml

# Display names of unused datasources as a flat list.
grafana-wtf explore datasources --format=json | jq -r '.unused[].datasource.name'
探索仪表板
如何找到使用不存在数据源仪表板?
# Display some details of all dashboards, including names of missing data sources.
grafana-wtf explore dashboards --format=yaml

# Display only dashboards which have missing data sources, along with their names.
grafana-wtf explore dashboards --format=json | \
    jq '.[] | select(.datasources_missing) | .dashboard + {ds_missing: .datasources_missing[] | [.name]}'
如何找到使用特定数据源的仪表板?
# Display all dashboards which use a specific data source, filtered by data source name.
grafana-wtf explore dashboards --format=json | jq '.[] | select(.datasources | .[].type=="<datasource_name>")'

# Display all dashboards using data sources with a specific type. Here: InfluxDB.
grafana-wtf explore dashboards --format=json | jq '.[] | select(.datasources | .[].type=="influxdb")'
如何列出所有仪表板中使用的所有查询?
grafana-wtf explore dashboards --data-details --queries-only --format=json | \
    jq '.[].details | values[] | .[] | .expr,.jql,.query,.rawSql | select( . != null and . != "" )'
搜索字符串
在所有仪表板和数据源中查找字符串 weatherbase
grafana-wtf find weatherbase
替换字符串
将仪表板 UID 为 _JJ22OZZk 中的 ldi_v2 替换为 ldi_v3
grafana-wtf --select-dashboard=_JJ22OZZk replace ldi_v2 ldi_v3
为了预览更改,您应先使用 --dry-run 选项
grafana-wtf --select-dashboard=_JJ22OZZk replace ldi_v2 ldi_v3 --dry-run
显示编辑历史
注意任何仪表板上的最近编辑活动?
# Display 50 most recent changes across all dashboards.
grafana-wtf log --number=50
示例
要发现更多命令行参数及其参数,请调用 grafana-wtf --help 并查看 grafana-wtf 示例。
开发
git clone https://github.com/grafana-toolbox/grafana-wtf
cd grafana-wtf

# Run all tests.
make test

# Run selected tests.
pytest --keepalive -vvv -k test_find_textual


下载文件
下载您平台上的文件。如果您不确定选择哪个,请了解更多关于 安装包 的信息。