Django NVD3 - d3.js图表库

项目描述
- 描述:
Django-nvd3是NVD3图形库的包装器
- nvd3:
NVD3 http://nvd3.org/
- d3:
Data-Driven Documents https://d3js.cn/
NVD3是尝试构建可重用的图表和图表组件,同时不剥夺d3.js所提供的功能。
安装
使用以下命令安装、升级和卸载django-nvd3
$ pip install django-nvd3
$ pip install --upgrade django-nvd3
$ pip uninstall django-nvd3
然后从您的Django项目中的settings.py编辑,并在‘INSTALLED_APPS’设置中添加‘django_nvd3’。
依赖项
Django-nvd3有一个主要依赖项
python-nvd3 : https://github.com/areski/python-nvd3
Bower将用于安装D3和NvD3,有关更多信息,请参阅Bower网站: http://bower.io/
Bower依赖于Node和npm。它通过npm全局安装
npm install -g bower
为了简化与Django的集成,我们建议您使用django-bower。
例如,要运行我们的演示项目,您需要从requirements.txt中安装依赖项,然后安装django-bower。django-bower不是必需的依赖项,因为用户应该可以自由地使用不同的方法安装JS文件。
安装django-bower
$ pip install django-bower
阅读Django-bower的文档,了解如何为您的项目正确配置它:https://github.com/nvbn/django-bower
然后在演示项目目录中,只需输入以下内容
$ python manage.py bower_install
$ python manage.py collectstatic
这将在“components”目录中创建一个目录,其中将安装d3 & nvd3。
您可以在demoproject中查看示例设置文件。
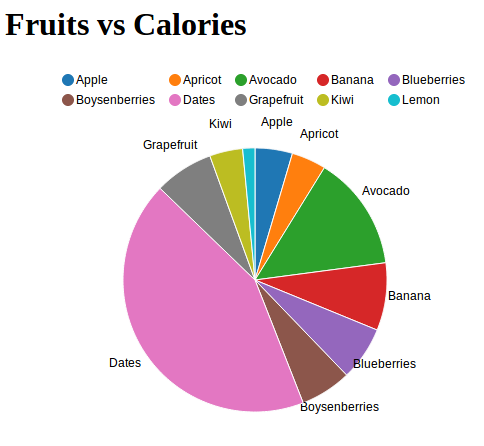
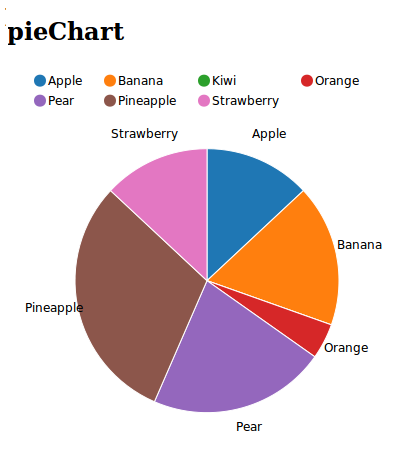
创建饼图示例
假设我们有一个简单的视图,其中我们想显示每种水果的热量。
因此,为了实现这一点,我们将编辑我们的view.py,我们将准备将要显示的数据
xdata = ["Apple", "Apricot", "Avocado", "Banana", "Boysenberries", "Blueberries", "Dates", "Grapefruit", "Kiwi", "Lemon"]
ydata = [52, 48, 160, 94, 75, 71, 490, 82, 46, 17]
chartdata = {'x': xdata, 'y': ydata}
charttype = "pieChart"
chartcontainer = 'piechart_container'
data = {
    'charttype': charttype,
    'chartdata': chartdata,
    'chartcontainer': chartcontainer,
    'extra': {
        'x_is_date': False,
        'x_axis_format': '',
        'tag_script_js': True,
        'jquery_on_ready': False,
    }
}
return render_to_response('piechart.html', data)
我们将使用包含‘charttype’和‘chartdata’的字典渲染模板‘piechart.html’。‘extra’将包含一个包含额外设置的列表
* ``x_is_date`` - if enabled the x-axis will be display as date format
* ``x_axis_format`` - set the x-axis date format, ie. "%d %b %Y"
* ``tag_script_js`` - if enabled it will add the javascript tag '<script>'
* ``jquery_on_ready`` - if enabled it will load the javascript only when page is loaded
    this will use jquery library, so make sure to add jquery to the template.
* ``color_category`` - Define color category (eg. category10, category20, category20c)
我们的模板piechart.html可能看起来像这样
{% load nvd3_tags %}
<head>
    {% include_chart_jscss %}
    {% load_chart charttype chartdata chartcontainer extra %}
</head>
<body>
    <h1>Fruits vs Calories</h1>
    {% include_container chartcontainer 400 600 %}
</body>
我们使用include包含D3/NVD3的JavaScript和CSS代码。我们开始准备并显示渲染饼图所需的JavaScript代码
{% load_chart charttype chartdata "piechart_container" extra %}
最后,我们创建一个div容器,该容器将用于显示图表。
结果将是一个美观且交互式的图表
有关更多示例,请参阅我们仓库中的demoproject目录,它显示了django-nvd3支持的图表的简单示例。
NVD3的实时演示
在jsfiddle上查看实时演示: http://jsfiddle.net/areski/z4zuH/246/
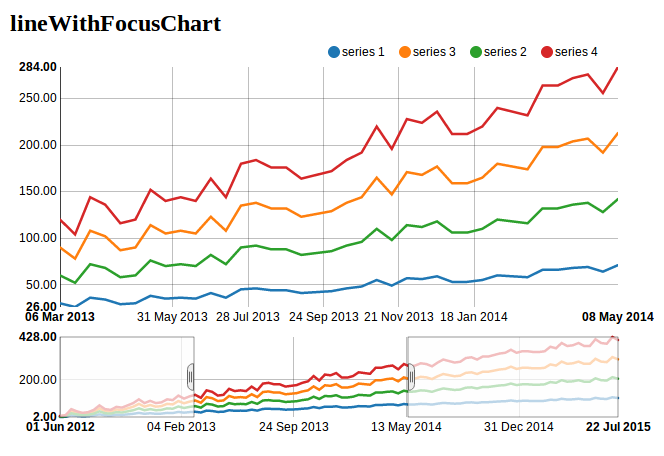
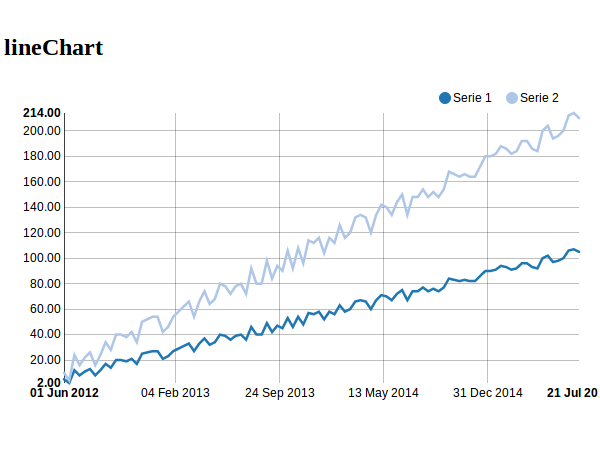
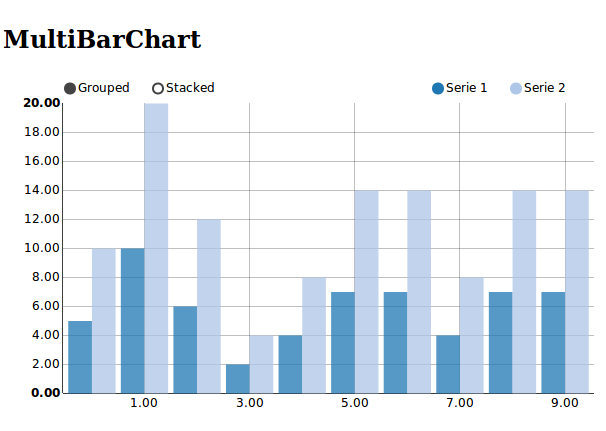
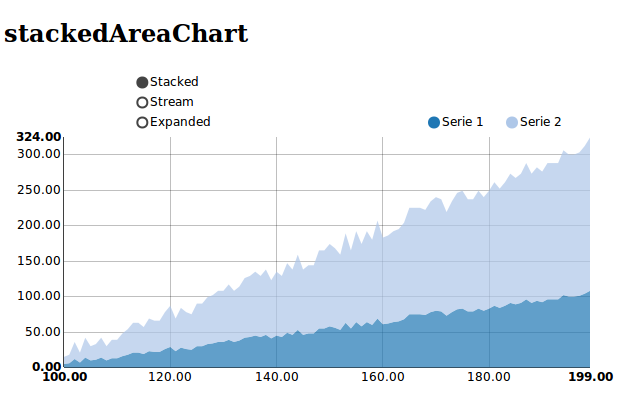
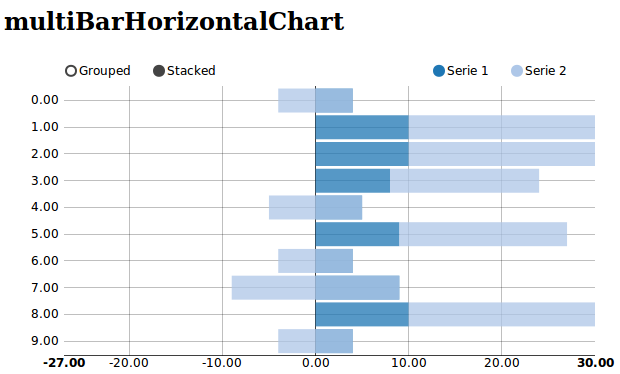
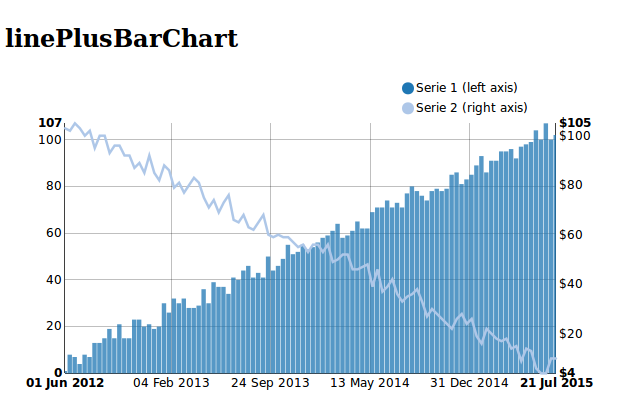
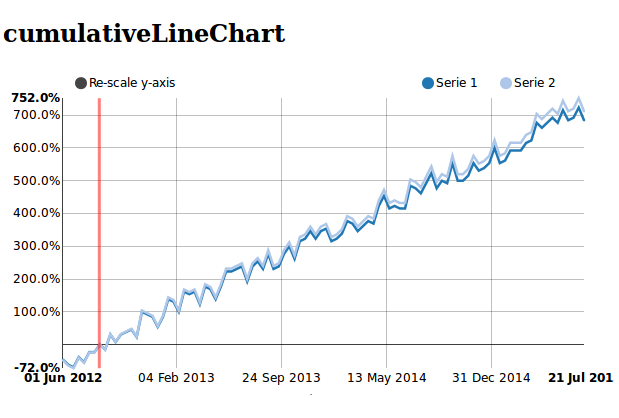
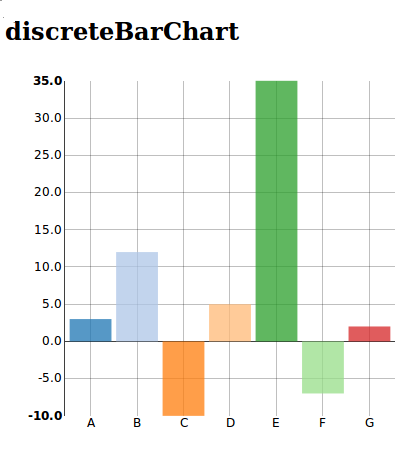
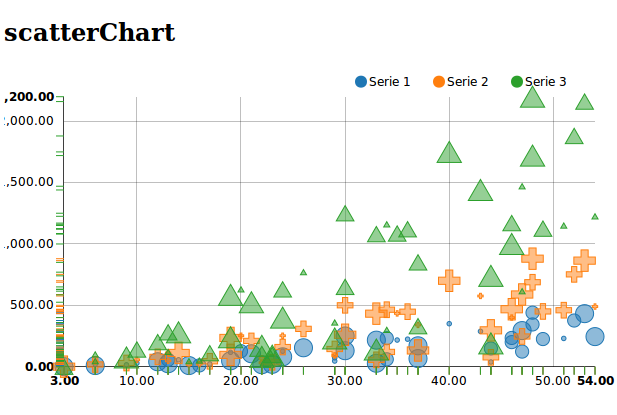
支持的nvd3图表
图表列表
使用Django-nvd3的项目
CDR-Stats: http://www.cdr-stats.org
Newfies-Dialer: http://www.newfies-dialer.org
文档
文档可在‘Read the Docs’上找到: http://django-nvd3.readthedocs.org
变更日志
变更日志摘要: https://github.com/areski/django-nvd3/blob/master/CHANGELOG.rst
许可协议
Django-nvd3受MIT许可协议保护,请参阅MIT-LICENSE.txt。
历史
0.9.7 (2015-12-10)
修复测试套件 + 移除python3.3支持(Django 1.9)
demoproject:将您的urlpatterns更新为django.conf.urls.url()实例的列表
0.9.4 (2015-10-28)
将test_requirements.txt添加到MANIFEST.in
0.9.2 (2015-10-27)
通过@lgp171188(L. Guruprasad)修复测试套件
为Python版本3.4 & 3.5添加Travis-CI测试
0.9.1 (2015-10-12)
将变更日志添加到MANIFEST.in
0.9.0 (2015-10-12)
添加charset到js脚本标签
0.8.2 (2015-04-06)
将python-nvd3升级到0.13.7
0.8.1 (2015-04-06)
修复linePlusBarWithFocusChart错误
0.8.0 (2015-04-06)
添加对nvd3版本1.7.1的支持
将python-nvd3升级到0.13.6
删除lineplusbarwithfocuschart
0.7.8 (2015-03-09)
python3 * 将‘unicode’替换为‘str’
0.6.1 (2013-12-05)
修复y系列未按字母顺序排序,感谢@miquelcamprodon
0.6.0 (2013-10-31)
在演示项目中修复包括js标签在html中的问题
更新simple_tag以与Django 1.3兼容
0.5.0 (2013-10-09)
更改设置行为,现在它使用通过kwargs传递的全局额外设置
重构
0.4.1 (2013-10-04)
discreteBarChart支持x轴上的日期
0.4.0 (2013-10-03)
支持新的图表linePlusBarWithFocusChart
0.3.1 (2013-09-30)
更新文档/ Readme
0.3.0 (2013-09-30)
使用Bower安装D3和NVD3
0.2.0 (2013-09-20)
默认启用调整大小
0.1.12 (2013-07-09)
通用axis_formatting
0.1.11 (2013-05-30)
Python3修复setup.py TypeError(由DanMeakin提供)
0.1.10 (2013-05-30)
添加多图表示例和测试
0.1.9 (2013-04-06)
确保我们在chartype参数中得到了一些东西 / 帮助测试
0.1.8 (2013-04-25)
选项:使用cdn或使用本地文件来使用JS和CSS
0.1.7 (2013-04-24)
添加自定义日期格式: x_axis_date_format * 以不同的格式显示x轴日期,例如“%d %b %Y”
0.1.6 (2013-04-23)
添加color_category:定义颜色类别(例如category10,category20,category20c)
0.1.5 (2013-04-23)
修复设置高度和宽度使用set_graph_height和set_graph_width
0.1.4 (2013-04-23)
添加tag_script_js:禁用javascript <script>标签
0.1.2 (2013-04-22)
将依赖项从python-nvd3修改为版本0.3,而不是0.3.3
0.1.1 (2013-04-22)
将依赖项修改为python-nvd3版本 * 修复lineChart工具提示
0.1 (2013-04-12)
正确发布项目,包括以下图表的支持
lineWithFocusChart
lineChart
multiBarChart
pieChart
stackedAreaChart
multiBarHorizontalChart
linePlusBarChart
cumulativeLineChart
discreteBarChart
scatterChart
0.0.1 (2013-04-09)
第一个版本


django-nvd3-0.10.1.tar.gz 的散列值
| 算法 | 散列摘要 | |
|---|---|---|
| SHA256 | c46922e095e5a86870cdeffffd5b8cf3b7d47c853a2e229eac98913c53053da8 |
|
| MD5 | 27fb31f978d3964420d2800df9fa0072 |
|
| BLAKE2b-256 | d2d061374b3f1119c932b48afa73296f6294d39794c70434cfd91a08b0ee4d70 |