A toolbox of small utilities to assist Django development

Project description
Introduction
The debugtools module offers some easy to use debugging utilities to assist Django development. It features:
A template tag to print context.
A XViewMiddleware variation which works for all request types.
A jQuery debug() function.
Installation
First install the module, preferably in a virtual environment. It can be installed from PyPI:
pip install django-debugtools
Or the current folder can be installed:
pip install .
Configuration
Add the module to the installed apps:
INSTALLED_APPS += (
    'debugtools',
)
Features
Print Template Tag
In Django templates, the following code can be used:
{% print variable1 variable2 %}
For example, when using the following code:
{% print original %}

{% print inline_admin_formset %}

{% for inline_admin_form in inline_admin_formset %}
    {% print inline_admin_form %}
    {% print inline_admin_form.form.name %}
{% endfor %}
It prints the context values, which helps to learn a lot about the template context:
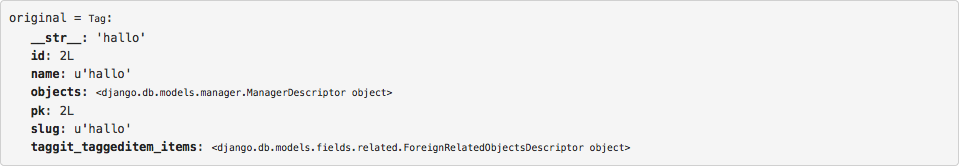
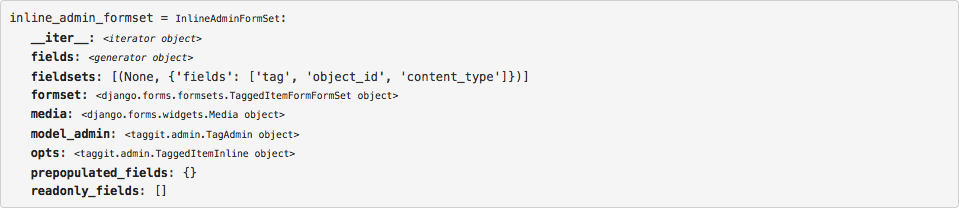
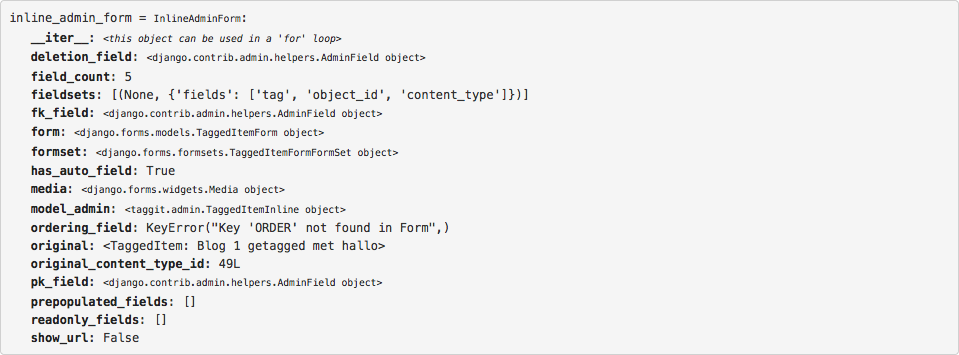
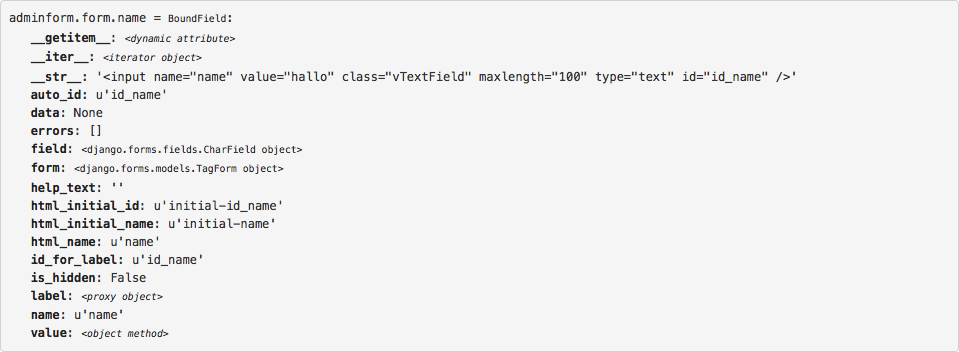
This makes it much easier to understand what the code provides to templates.
When no variables are given (e.g. {% print %}), all context variables are displayed:
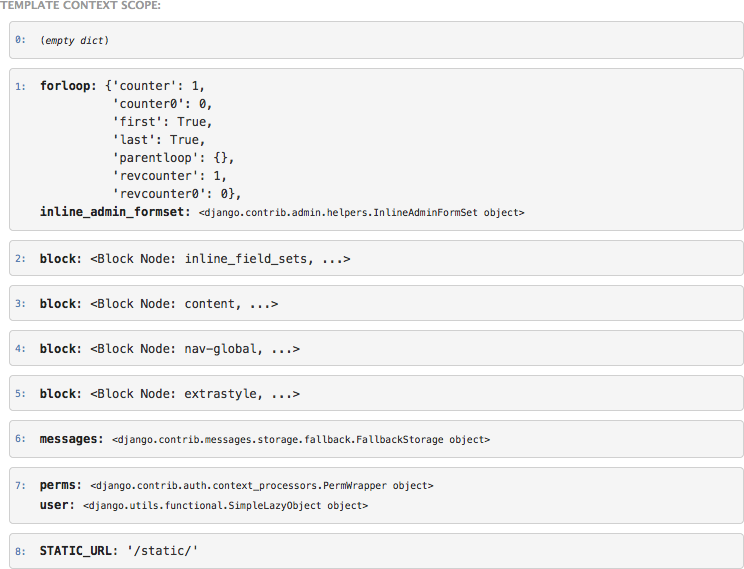
The template context variables are printed in a customized pprint.pformat format, for easy reading. Note no {% load %} tag is needed; the {% print %} function is added to the template builtins for debugging convenience.
Print Queries template tag
For convenience, there is also a {% print_queries %} tag, based on http://djangosnippets.org/snippets/93/
For more sophisticated debugging, you may want to use the django-debug-toolbar for this job.
X-View Middleware
Add the following setting:
INTERNAL_IPS = (
    '127.0.0.1',
)

MIDDLEWARE_CLASSES += (
    'debugtools.middleware.XViewMiddleware',
)
All requests from the internal IP, or made by the admin user will have a X-View header and X-View-Template header. In the Firebug console, or Chrome web inspector, you can see which view and template handled the current request:

jQuery debug print
Add the following to the page:
<script type="text/javscript" src="{{ STATIC_URL }}debugtools/jquery.debug.js"></script>
Now you can print the jQuery selector context to the console:
$("#foo").children('li').debug().addClass('bar');
This will print the matched <li> elements in the console, among with the current jQuery selector. Optionally, a prefix can be included in the debug() call:
$("#foo").debug("at baz: ").addClass('bar');


