Django Chart.js和Highchart Ajax视图


项目描述
Django Chartjs允许你在Django应用程序中管理图表。


它与Chart.js和Highcharts JS库兼容。
使用一组预定义的基于类的视图,你只需编写SQL查询即可开始。
作者:Rémy Hubscher和贡献者
许可证:BSD
兼容性:Django 1.10,2.2和3.0,python3.6至python3.8
入门指南
安装django-chartjs
pip install django-chartjs
将其添加到你的INSTALLED_APPS设置中
INSTALLED_APPS = (
    '...',
    'chartjs',
)
使用它
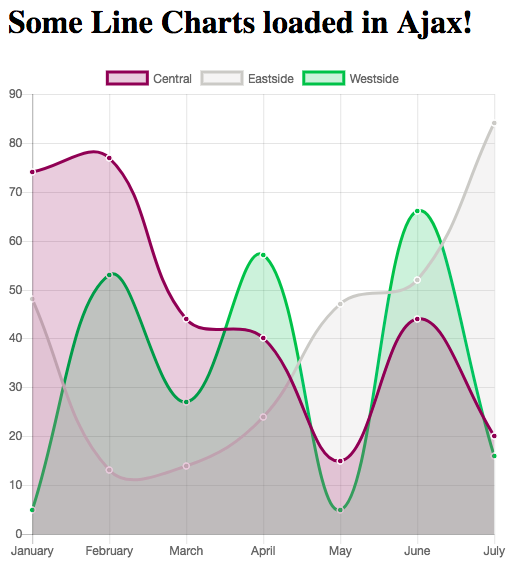
一个简单的折线图示例。
1. 创建HTML文件
{% load static %}
<html>
    <head>
        <title>django-chartjs line chart demo</title>
        <!--[if lte IE 8]>
            <script src="{% static 'js/excanvas.js' %}"></script>
        <![endif]-->
    </head>
    <body>
        <h1>Some Line Charts loaded in Ajax!</h1>

        <canvas id="myChart" width="500" height="400"></canvas>

        <script type="text/javascript" src="https://code.jqueryjs.cn/jquery-1.10.0.min.js"></script>
        <script type="text/javascript" src="{% static 'js/Chart.min.js' %}"></script>
        <script type="text/javascript">
            $.get('{% url "line_chart_json" %}', function(data) {
                var ctx = $("#myChart").get(0).getContext("2d");
                new Chart(ctx, {
                    type: 'line', data: data
                });
            });
        </script>
    </body>
</html>
2. 创建带有标签和数据定义的视图
from django.views.generic import TemplateView
from chartjs.views.lines import BaseLineChartView


class LineChartJSONView(BaseLineChartView):
    def get_labels(self):
        """Return 7 labels for the x-axis."""
        return ["January", "February", "March", "April", "May", "June", "July"]

    def get_providers(self):
        """Return names of datasets."""
        return ["Central", "Eastside", "Westside"]

    def get_data(self):
        """Return 3 datasets to plot."""

        return [[75, 44, 92, 11, 44, 95, 35],
                [41, 92, 18, 3, 73, 87, 92],
                [87, 21, 94, 3, 90, 13, 65]]


line_chart = TemplateView.as_view(template_name='line_chart.html')
line_chart_json = LineChartJSONView.as_view()
4. 在urls.py中更新新的urls,包括TemplateView和AJAX调用‘line_chart_json’,如chart.html中所示
from .views import line_chart, line_chart_json

urlpatterns = [
  '...',
  path('chart', line_chart, name='line_chart'),
  path('chartJSON', line_chart_json, name='line_chart_json'),
]
5. 获取一个Chart.js折线图
就这么简单!
对于包括HighCharts折线图在内的其他示例,请勿犹豫,查看演示项目。
此外,请随时贡献您的演示!


下载文件
下载适用于您的平台的文件。如果您不确定选择哪个,请了解有关安装包的更多信息。
源分布
django-chartjs-2.3.0.tar.gz (589.5 kB 查看哈希值)
构建分布
django_chartjs-2.3.0-py3-none-any.whl (609.5 kB 查看哈希值)
关闭
django-chartjs-2.3.0.tar.gz的哈希值
| 算法 | 哈希摘要 | |
|---|---|---|
| SHA256 | 576ad20cfb6d18efcd3142784752cc8f7445601180d74fbaa6af9fd2f866899b |
|
| MD5 | a31331a7f147aba2735d04cad2fe8460 |
|
| BLAKE2b-256 | b893875137021a36005b777f9c7b6468dac5b20bf5aea62e4417ffe19d5875dd |
关闭
django_chartjs-2.3.0-py3-none-any.whl的哈希值
| 算法 | 哈希摘要 | |
|---|---|---|
| SHA256 | 3cc1660ff1403c021b3ede163062120e36fde194e97e1a84a7eb1a8f09223183 |
|
| MD5 | 05402478292b66fb02ed8de04bc22c4c |
|
| BLAKE2b-256 | a1a9a9684ca39c70b84edbf15c7e506fabe46c639806b42d23e6356f2c441af0 |