使用几何对象作为matplotlib路径和补丁

项目描述
使用 Shapely 或类似GeoJSON的几何对象作为matplotlib路径和补丁
需要:matplotlib、numpy,以及可选的Shapely 1.2+。
示例
from matplotlib import pyplot
from shapely.geometry import LineString
from descartes import PolygonPatch
BLUE = '#6699cc'
GRAY = '#999999'
def plot_line(ax, ob):
x, y = ob.xy
ax.plot(x, y, color=GRAY, linewidth=3, solid_capstyle='round', zorder=1)
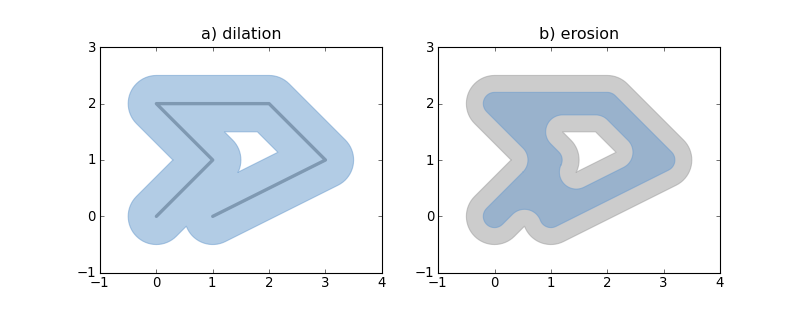
line = LineString([(0, 0), (1, 1), (0, 2), (2, 2), (3, 1), (1, 0)])
fig = pyplot.figure(1, figsize=(10, 4), dpi=180)
# 1
ax = fig.add_subplot(121)
plot_line(ax, line)
dilated = line.buffer(0.5)
patch1 = PolygonPatch(dilated, fc=BLUE, ec=BLUE, alpha=0.5, zorder=2)
ax.add_patch(patch1)
#2
ax = fig.add_subplot(122)
patch2a = PolygonPatch(dilated, fc=GRAY, ec=GRAY, alpha=0.5, zorder=1)
ax.add_patch(patch2a)
eroded = dilated.buffer(-0.3)
# GeoJSON-like data works as well
polygon = eroded.__geo_interface__
# >>> geo['type']
# 'Polygon'
# >>> geo['coordinates'][0][:2]
# ((0.50502525316941682, 0.78786796564403572), (0.5247963548222736, 0.8096820147509064))
patch2b = PolygonPatch(polygon, fc=BLUE, ec=BLUE, alpha=0.5, zorder=2)
ax.add_patch(patch2b)
pyplot.show()
另请参阅:examples/patches.py。
Descartes与同名且显然已停止运营的项目无关,该项目的网址为http://descartes.sourceforge.net/。


下载文件
下载适合您平台的文件。如果您不确定选择哪个,请了解更多关于 安装包 的信息。
源代码分布
descartes-1.1.0.tar.gz (3.5 kB 查看哈希值)
构建分布
descartes-1.1.0-py3-none-any.whl (5.8 kB 查看散列值)
descartes-1.1.0-py2-none-any.whl (5.8 kB 查看散列值)
关闭
descartes-1.1.0.tar.gz的散列值
| 算法 | 散列摘要 | |
|---|---|---|
| SHA256 | 135a502146af5ed6ff359975e2ebc5fa4b71b5432c355c2cafdc6dea1337035b |
|
| MD5 | ac608090f3c9f6e0ce856fdc29944096 |
|
| BLAKE2b-256 | 1d6f81735a30432b74f41db6754dd13869021ccfed3088d1cf7a6cfc0af9ac49 |
关闭
descartes-1.1.0-py3-none-any.whl的散列值
| 算法 | 散列摘要 | |
|---|---|---|
| SHA256 | 4c62dc41109689d03e4b35de0a2bcbdeeb81047badc607c4415d5c753bd683af |
|
| MD5 | eda7c3b1cef798ee4878d96c718b2cef |
|
| BLAKE2b-256 | e5b61ed2eb03989ae574584664985367ba70cd9cf8b32ee8cad0e8aaeac819f3 |
关闭
descartes-1.1.0-py2-none-any.whl的散列值
| 算法 | 散列摘要 | |
|---|---|---|
| SHA256 | b7e412e7e6e294412f1d0f661f187babc970088c2456089e6801eebb043c2e1b |
|
| MD5 | fe9c91d7ca7f24d84ad0aa3eb8087868 |
|
| BLAKE2b-256 | e729b23b57c92a1cf58da25070c10cab90fb38de22523ef7bdc76acdad717645 |