支持多页面、模块和Pareto图等新图表的对象导向方法的Python包,适用于Plotly/Dash应用程序

项目描述
dash_charts
注意
在2019-2020年间,我正在使用Dash构建应用程序,并希望找到一种方法使它们更易于组合和重用。从那时起,我转向了其他项目,而Dash已经变得更加易于组合。随着生态系统的演变,Dash扩展了plotly express,并引入了模板以及其他更改!
鉴于Dash的进步,我打算归档此项目,发布到PyPi的最终版本,并继续其他项目。
支持多页面、模块和Pareto图等新图表的对象导向方法的Python包,适用于Plotly/Dash应用程序
包括用于构建自定义图表或应用程序的基类、Pareto图等新图表,以及用于标签或多页应用的基类。请参阅完整的文档https://kyleking.me/dash_charts/。(待定:当前不在线)
快速入门
1. 安装
使用 Poetry 安装 dash_charts:poetry add dash_charts --git https://github.com/KyleKing/dash_charts.git#main
2. 示例代码
"""Example Dash Application."""

from typing import Optional

import dash
from dash import html
import plotly.express as px
from box import Box
from implements import implements

from dash_charts.pareto_chart import ParetoChart
from dash_charts.utils_app import AppBase, AppInterface
from dash_charts.utils_fig import min_graph

# FIXME: the change to use Box/_ID needs to be implemented in the examples. This is causing failures in the test cases
#   Still pending if this is the preferred approach
_ID = Box({
    'chart': 'pareto',
})
"""Default App IDs."""


@implements(AppInterface)
class ParetoDemo(AppBase):
    """Example creating a simple Pareto chart."""

    def __init__(self, app: Optional[dash.Dash] = None) -> None:
        """Initialize app and initial data members. Should be inherited in child class and called with super().

        Args:
            app: Dash instance. If None, will create standalone app. Otherwise, will be part of existing app

        """
        self.name = 'Car Share Pareto Demo'
        self.data_raw = None
        self.chart_main = None
        self._id = _ID

        super().__init__(app=app)

    def generate_data(self) -> None:
        """Format the car share data from plotly express for the Pareto. Called by parent class."""
        self.data_raw = (px.data.carshare()
                         .rename(columns={'peak_hour': 'category', 'car_hours': 'value'}))
        self.data_raw['category'] = [f'H:{cat:02}' for cat in self.data_raw['category']]

    def create_elements(self) -> None:
        """Initialize the charts, tables, and other Dash elements."""
        self.chart_main = ParetoChart(title='Car Share Pareto', xlabel='Peak Hours', ylabel='Car Hours')

    def return_layout(self) -> dict:
        """Return Dash application layout.

        Returns:
            dict: Dash HTML object

        """
        return html.Div([
            html.Div([min_graph(
                id=self._il[self._id.chart],
                figure=self.chart_main.create_figure(df_raw=self.data_raw),
            )]),
        ])

    def create_callbacks(self) -> None:
        """Register the callbacks."""
        pass  # Override base class. Not necessary for this example


if __name__ == '__main__':
    app = ParetoDemo()
    app.create()
    app.run(debug=True)
else:
    app = instance()
    app.create()
    FLASK_HANDLE = app.get_server()
3. 结果Pareto图

4. 其他说明
为了充分利用这些工具,你可能还想添加 calcipy 并将以下片段添加到你的 pyproject.toml 文件中
[tool.poetry.dev-dependencies.dash]
extras = [ "testing",]
version = "*, ^1.19"

[tool.poetry.dependencies.calcipy]
git = "https://github.com/kyleking/calcipy.git"
branch = "dev/development"
rev = "01635ea"  # Always pin to a commit
develop = true  # Optional: will reinstall each time

[tool.poetry.dev-dependencies.calcipy]
git = "https://github.com/kyleking/calcipy.git"
branch = "dev/development"
extras = [ "dev", "lint", "test", "commitizen_legacy"]
你还需要至少从 dodo.py 和 dash_charts 的文件夹结构中获取内容
设计原则
我想展示面向对象的编程方法对于提高 Dash 项目的代码重用性和可读性是非常有价值的。以下是一些设计原则,我在实现这个包时都尽力考虑到了。
- 尽量将所有应用程序逻辑(回调、id等)封装在应用程序类或模块中
- 对于在应用程序之间重复使用的组件,创建一个
模块。布局、状态和回调都可以委托给模块,而不是杂乱无章地堆放在主应用程序的类中,这样可以更好地实现代码重用 - 将任何不需要状态(
self)的方法移动到独立函数中 - 如果你可以将 Dash(ids/layout/Callbacks)和 Plotly(图形/表格)代码分开,你可以更轻松地生成静态 HTML 或 PNG。有时在程序生成视图时,静态输出比每次调整交互式输入更有用。
总的来说,我发现这个包极大地提高了我的 Dash 代码质量,并希望其他人也能发现它的有用性。如果你有任何反馈,请随时提交 PR 或打开问题。有关设计决策和包架构的更多信息,请参阅 ./DESIGN.md
本地开发
从 Github 克隆代码、创建 Python 虚拟环境和运行第一个示例应用程序的初始命令
git clone https://github.com/KyleKing/dash_charts.git
cd dash_charts
poetry install
poetry shell
python tests/examples/ex_app_px.py
用于测试、文档和其他用途的其他有用脚本
poetry run ptw -- -m "not INTERACTIVE"
poetry run doit run test
poetry run doit
示例图表和表格
以下是每个图表或表格的示例代码截图和链接,这些图表或表格包含在 dash_charts 中
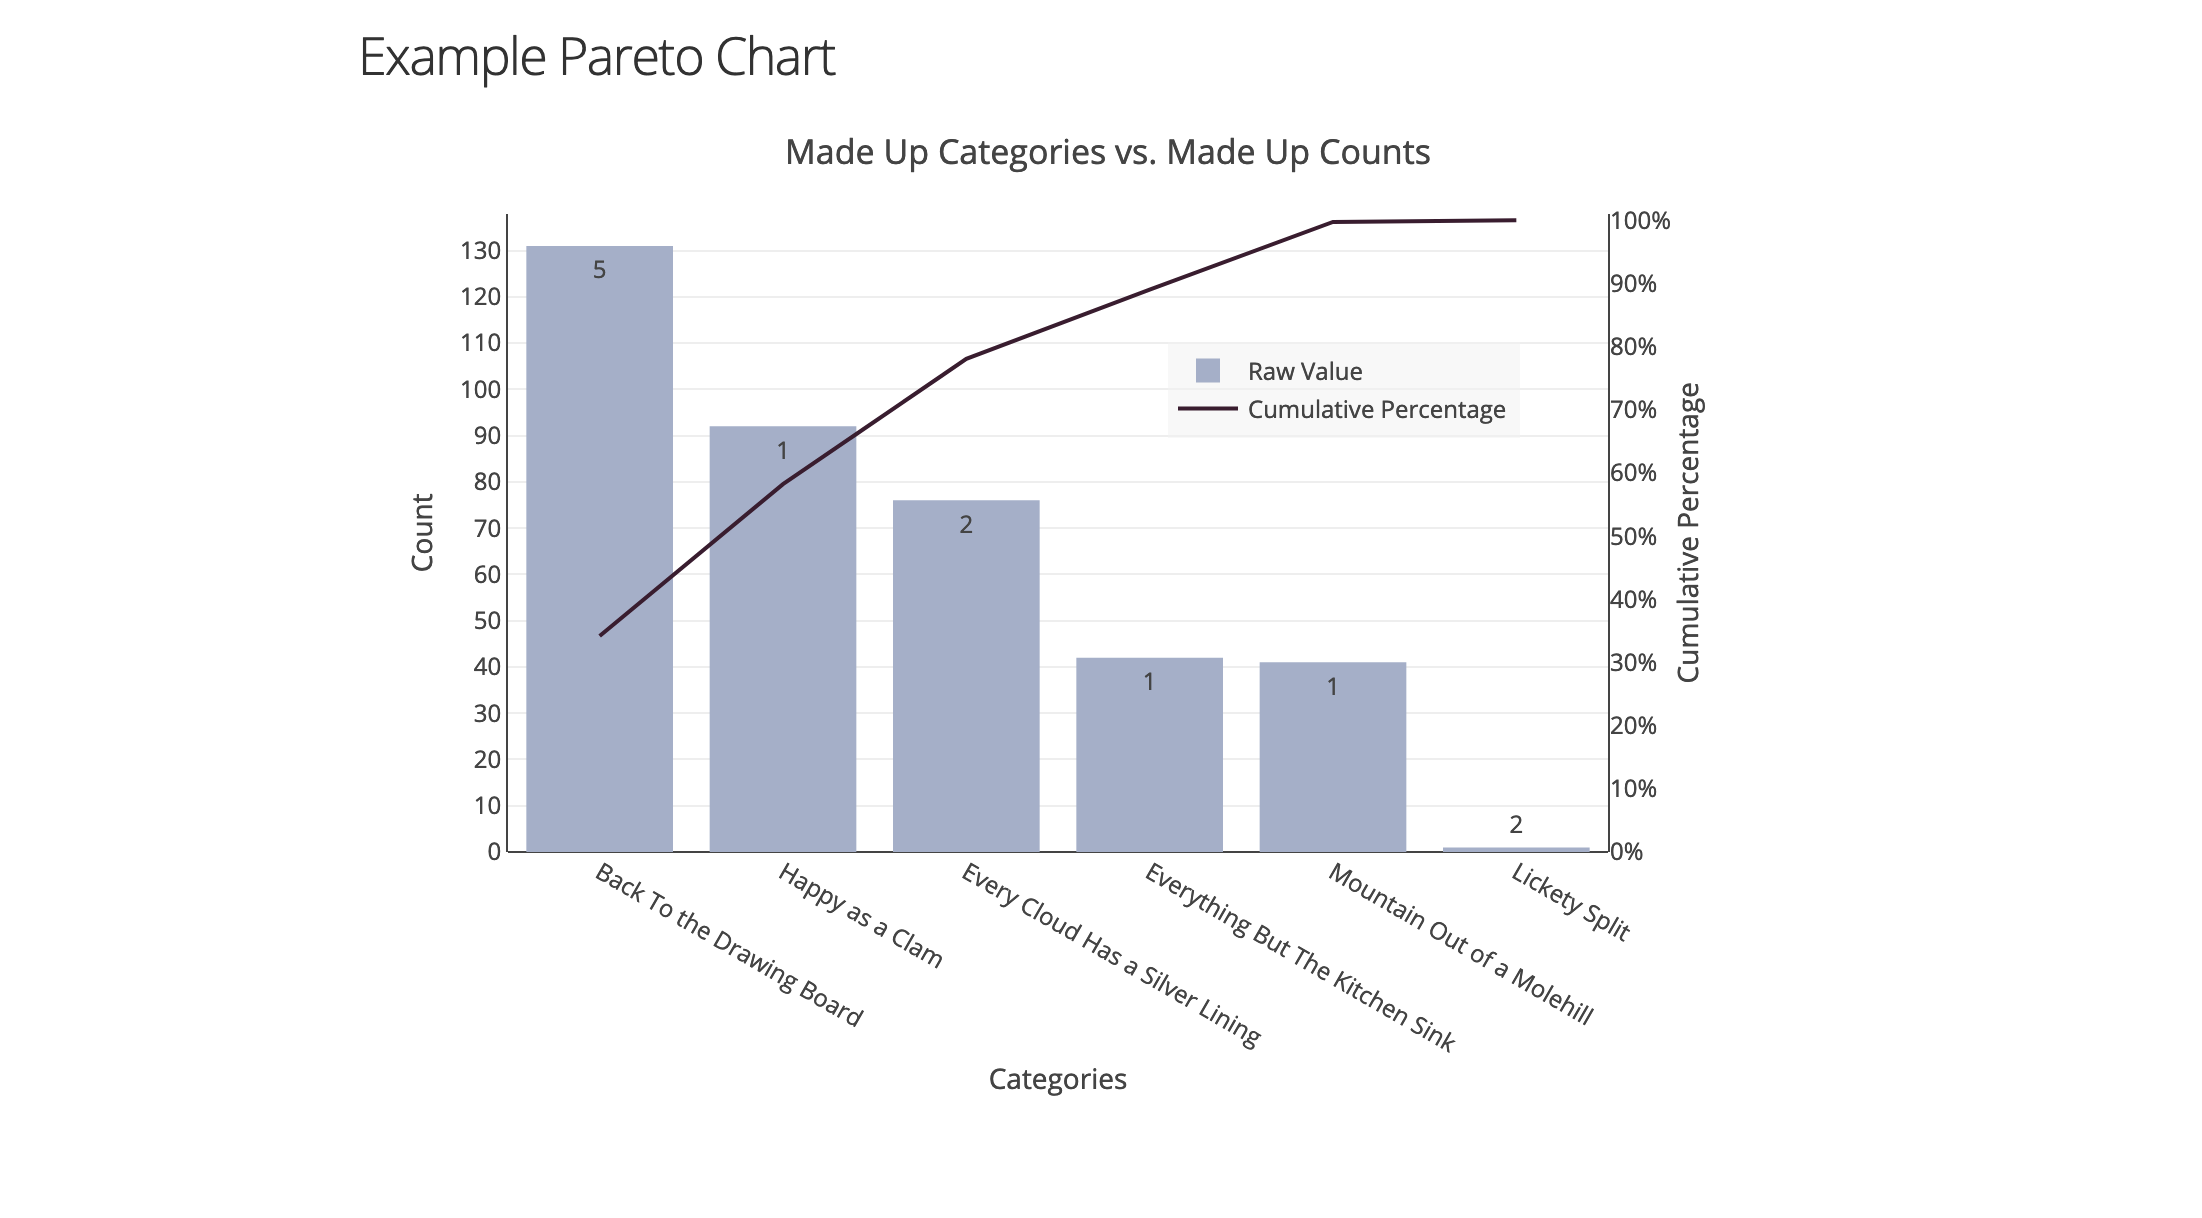
Pareto图
在 Dash 中创建帕累托图。处理分类排序、计算累积百分比并配置两个 Y 轴。
请参阅 tests/examples/ex_pareto_chart.py 中的示例代码。以下为截图
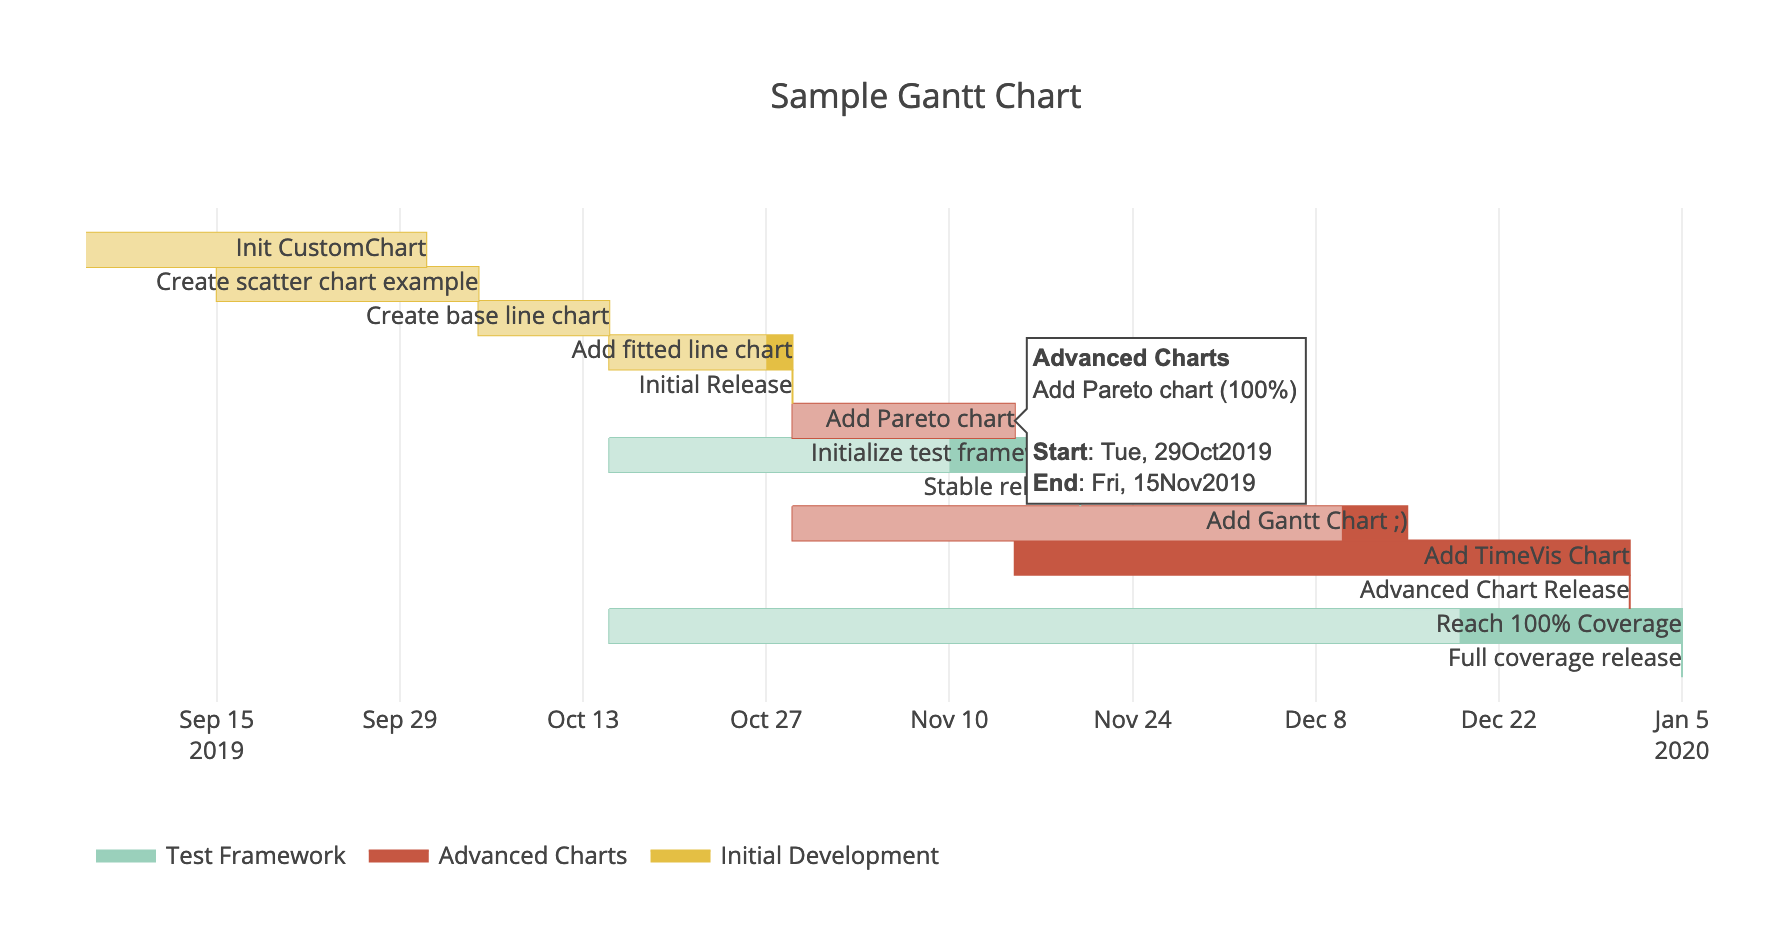
甘特图
在 Dash 中创建简单的甘特图。不支持更高级的功能,如依赖关系和资源分配,但可以清晰地显示任务、进度和项目。您可以切换不同的项目开关,并像正常的 Plotly 图表一样使用缩放。
请参阅 tests/examples/ex_gantt_chart.py 中的示例代码。以下为截图
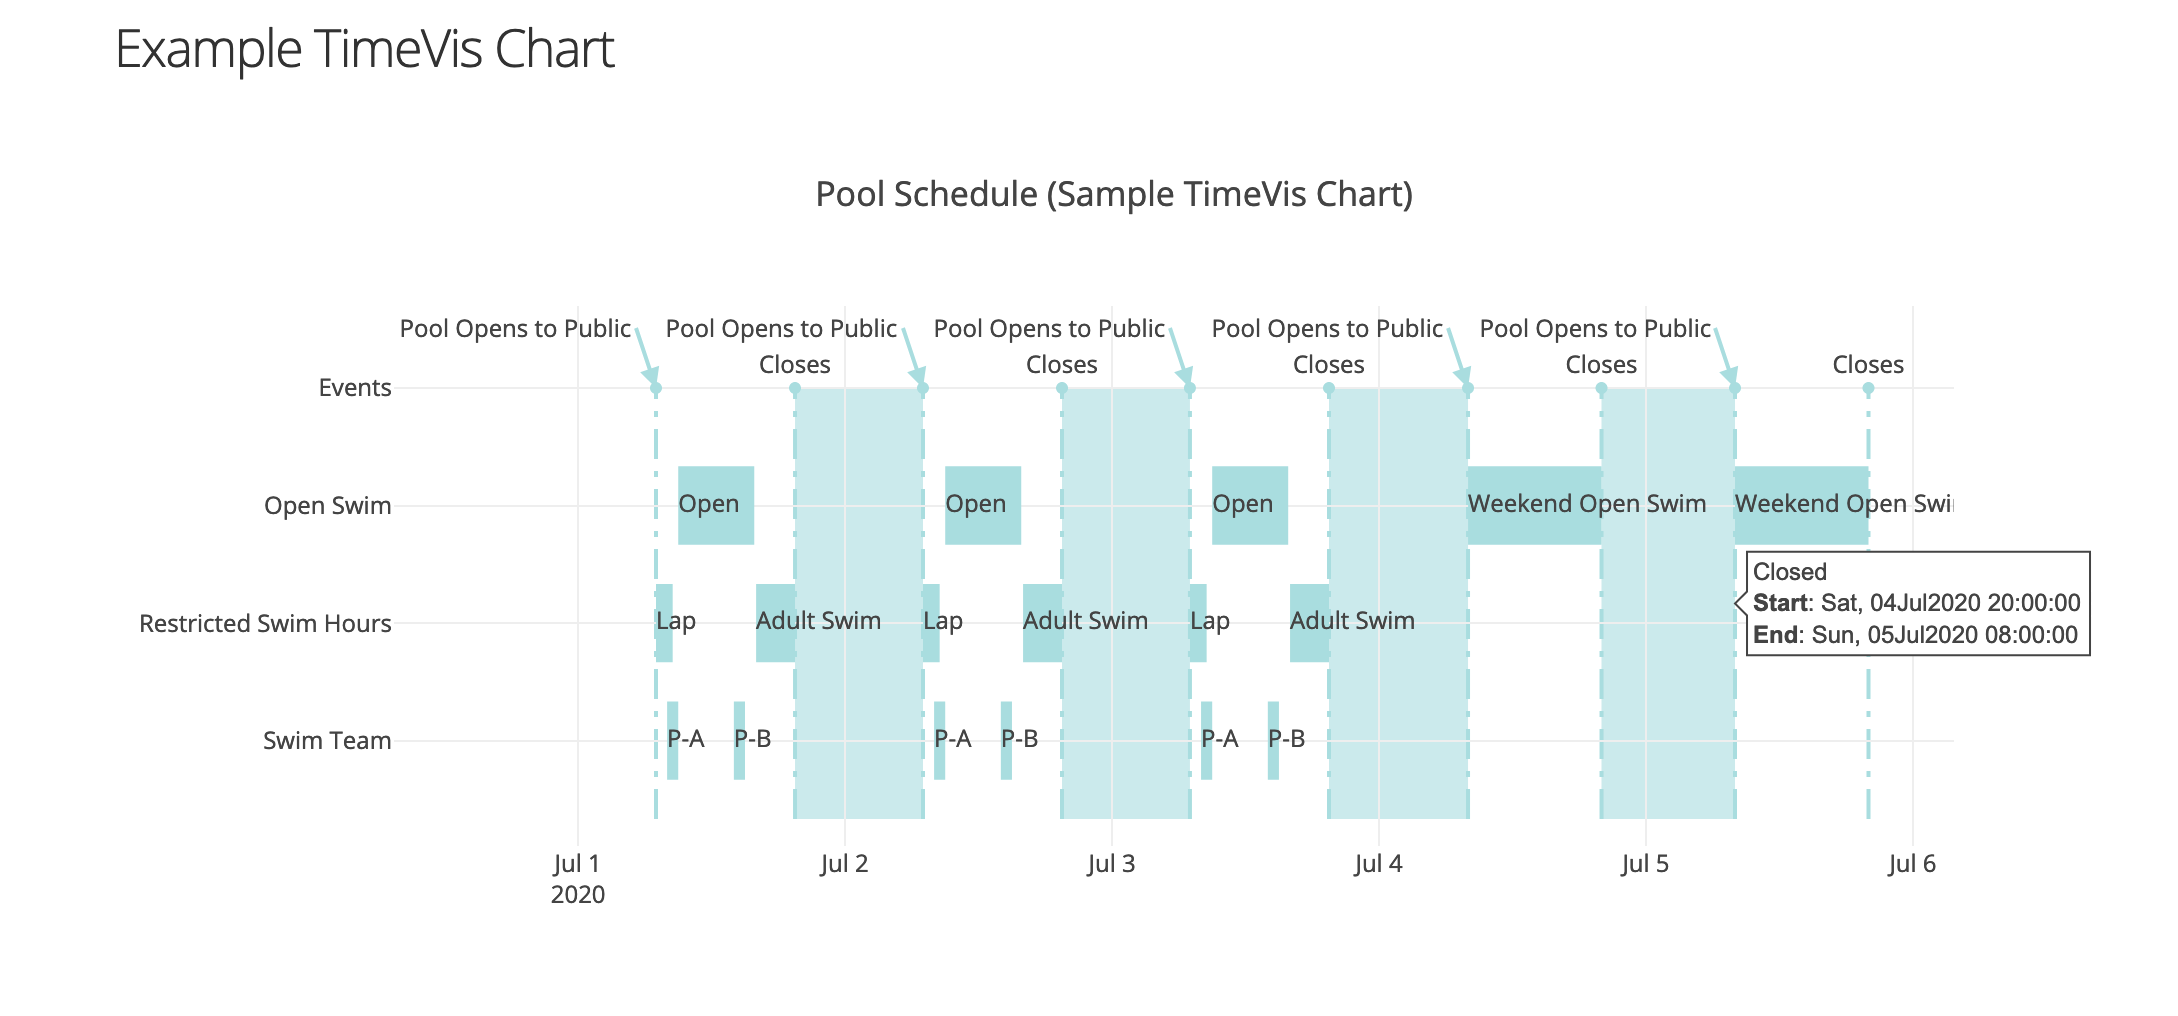
时间视图图
创建一个 TimeVis 图表来绘制基于 daattali/timevis(R)的通用时间可视化。此图表与甘特图不同,因为它显示了在同一行中重复的事件。
请参阅 tests/examples/ex_time_vis_chart.py 中的示例代码。以下为截图
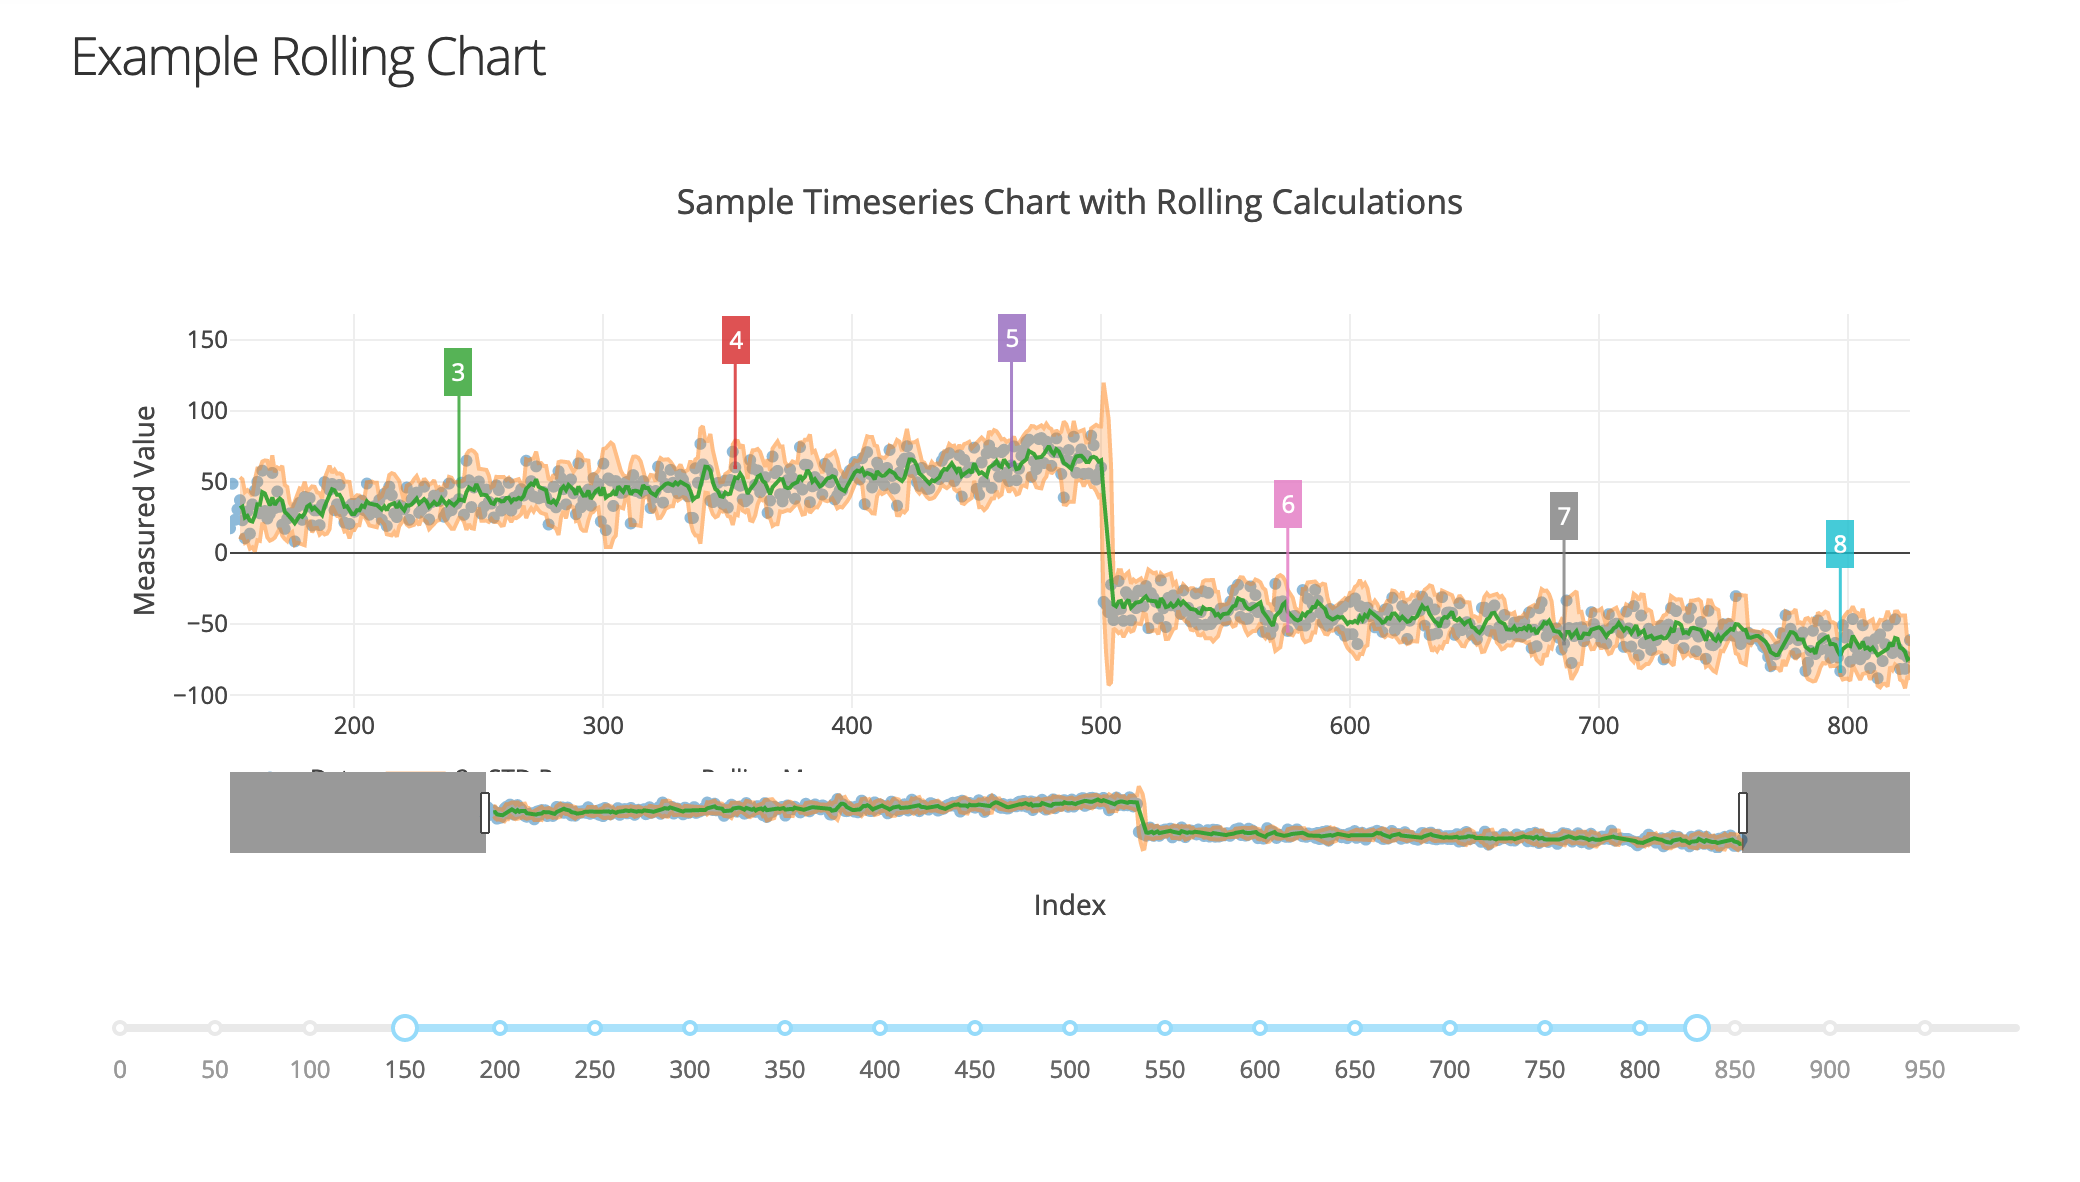
滚动均值和标准差图表
轻松绘制给定散点数据集的滚动均值和标准差。演示了使用图表注释。
请参阅 tests/examples/ex_rolling_chart.py 中的示例代码。以下为截图
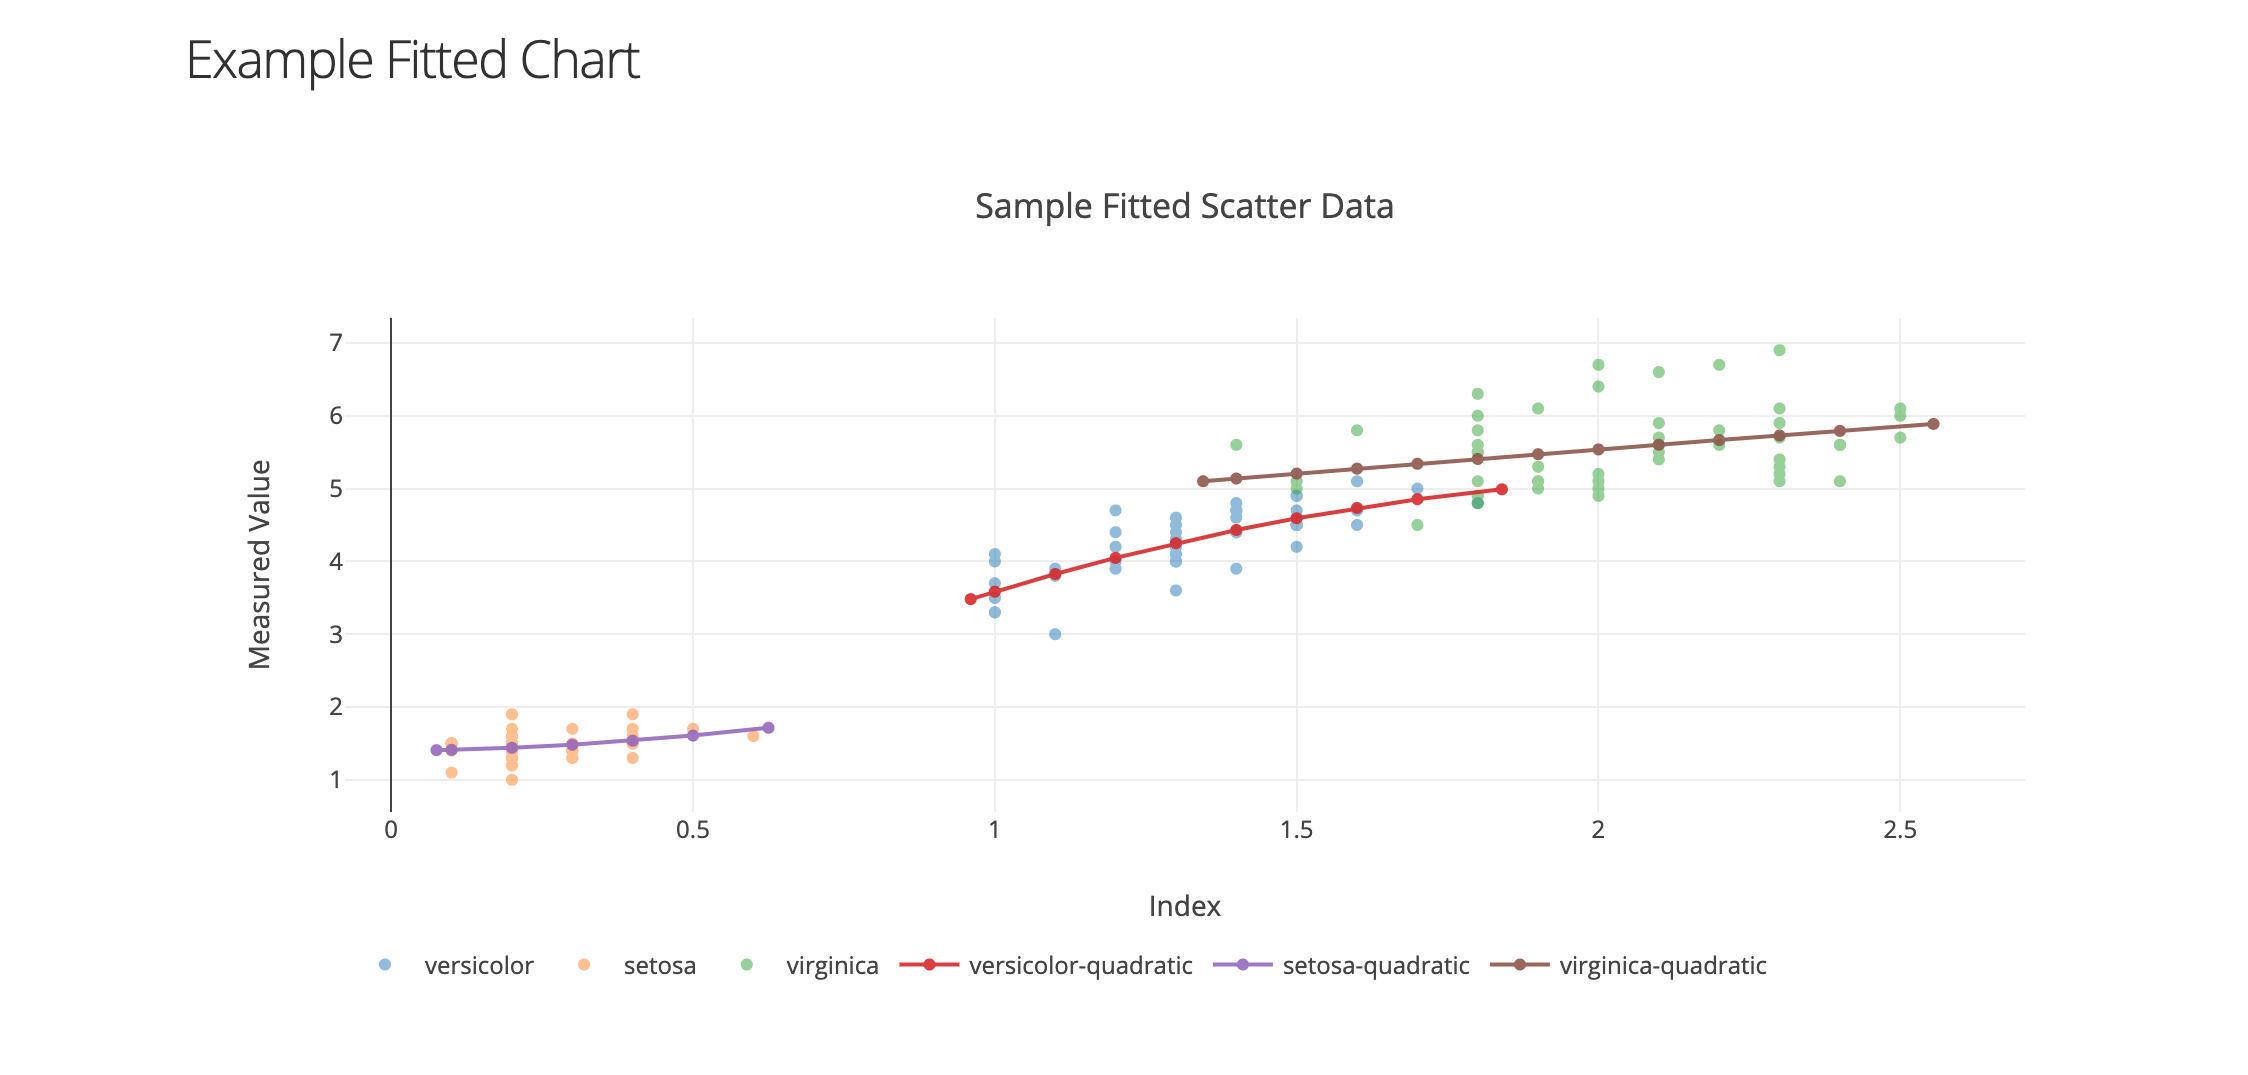
拟合图表
用指定的方程拟合任意散点数据。悬停时将显示四舍五入的拟合参数。对于实验新数据非常有用。
请参阅 tests/examples/ex_fitted_chart.py 中的示例代码。以下为截图
实时SQL演示
使用滚动图展示来自SQLite数据库的实时数据示例。为了演示,后台线程在Dash应用程序在单独的线程中运行时填充数据库。
请参阅示例代码 tests/examples/ex_sqlite_realtime.py。以下为截图
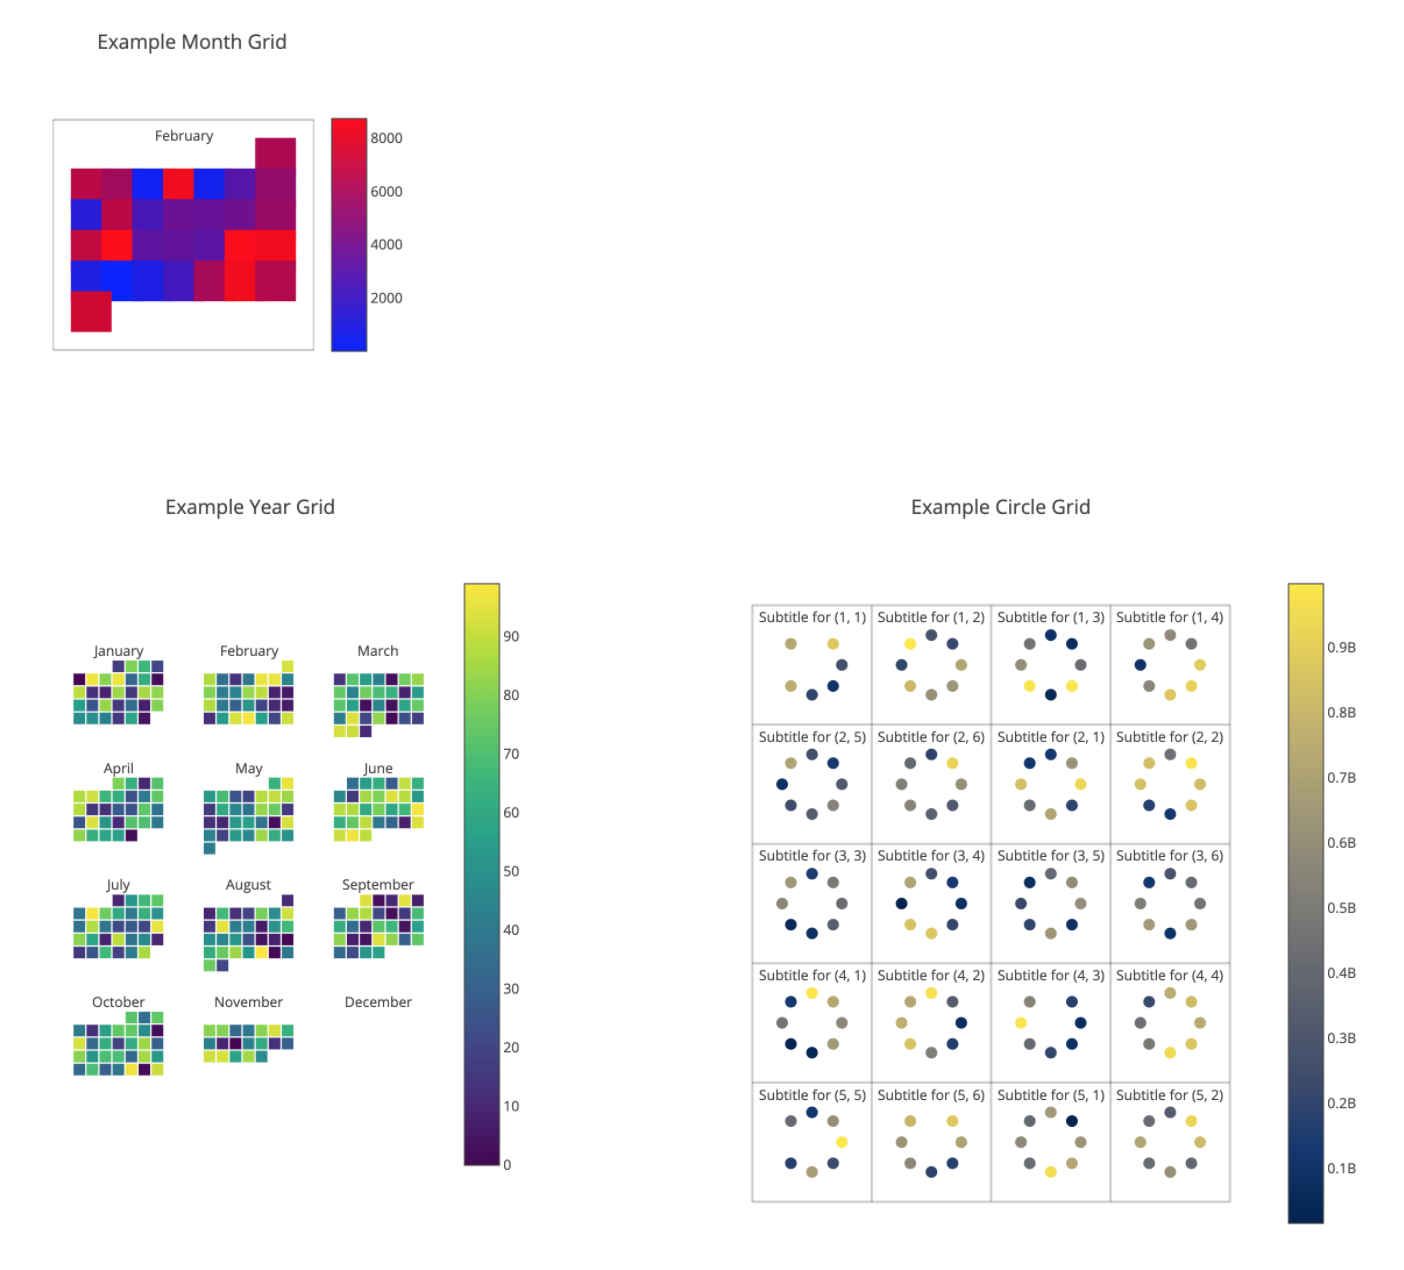
坐标图表
在二维平面上绘制具有强度颜色的离散数据集。以下示例展示了如何使用YearGrid()、MonthGrid()和CircleGrid()类
请参阅示例代码 tests/examples/ex_coordinate_chart.py。以下为截图
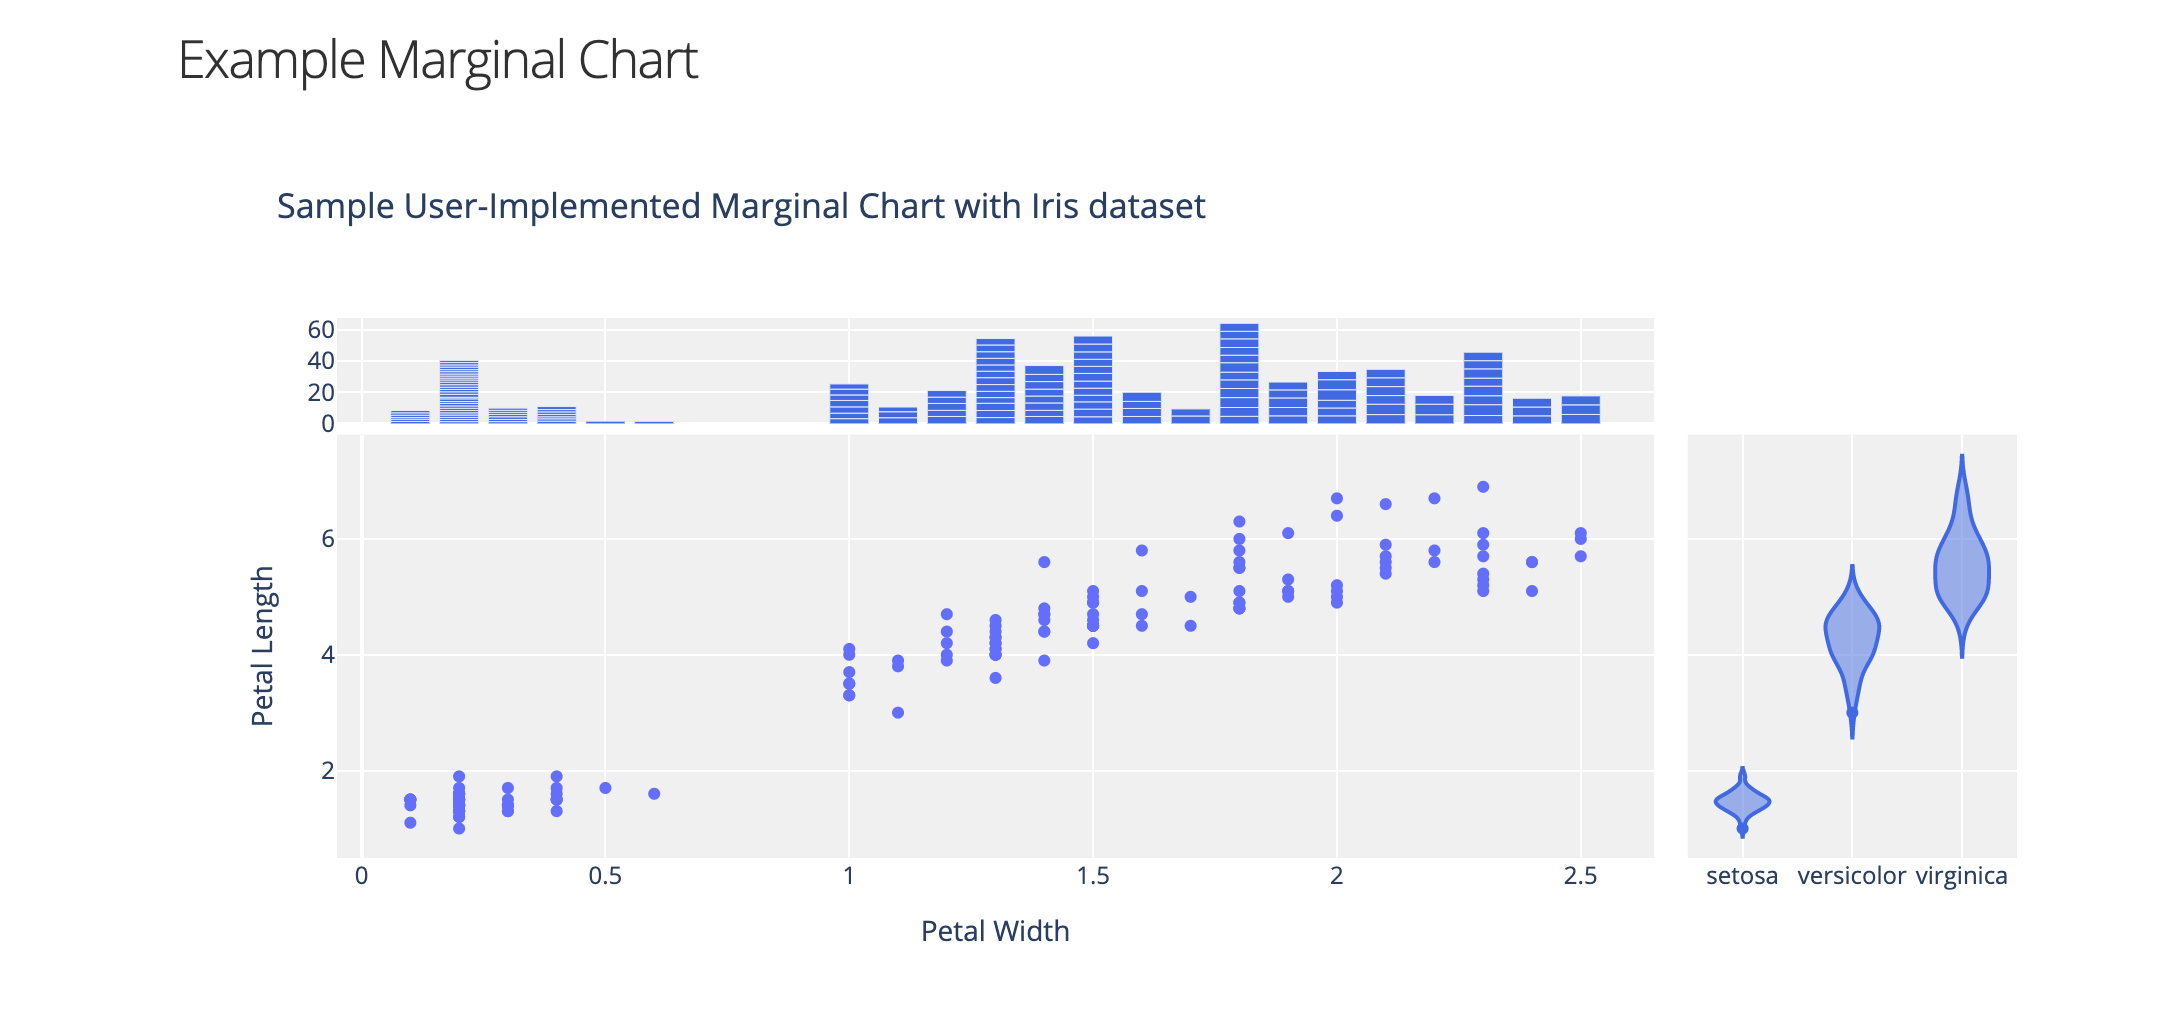
边际图表
从utils_fig.MarginalChart创建新图表的示例
请参阅示例代码 tests/examples/ex_marginal_chart.py。以下为截图
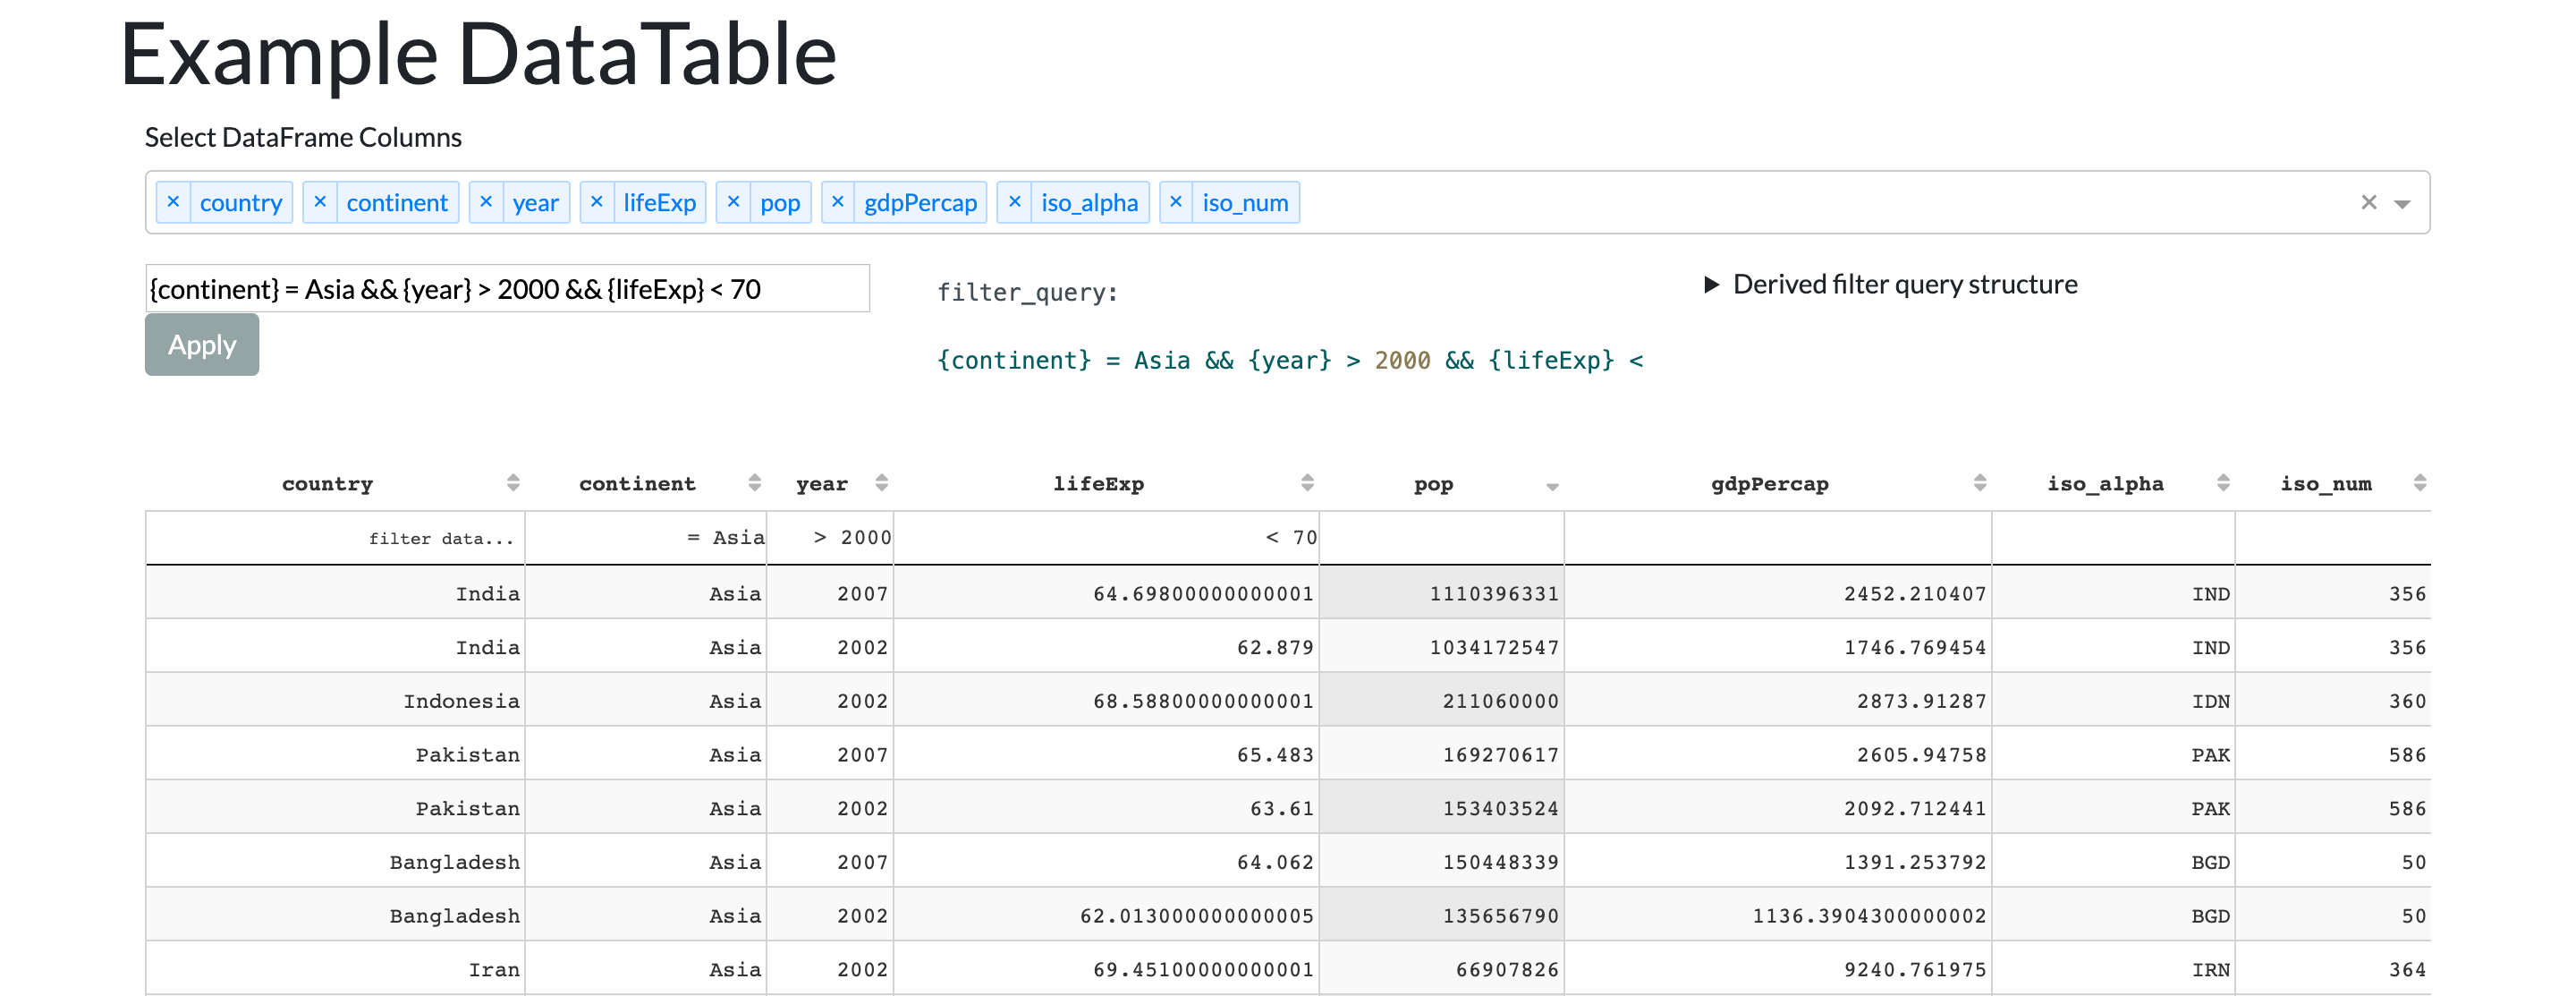
数据表模块
从dataframe显示Dash数据表
请参阅示例代码 tests/examples/ex_datatable.py。以下为截图
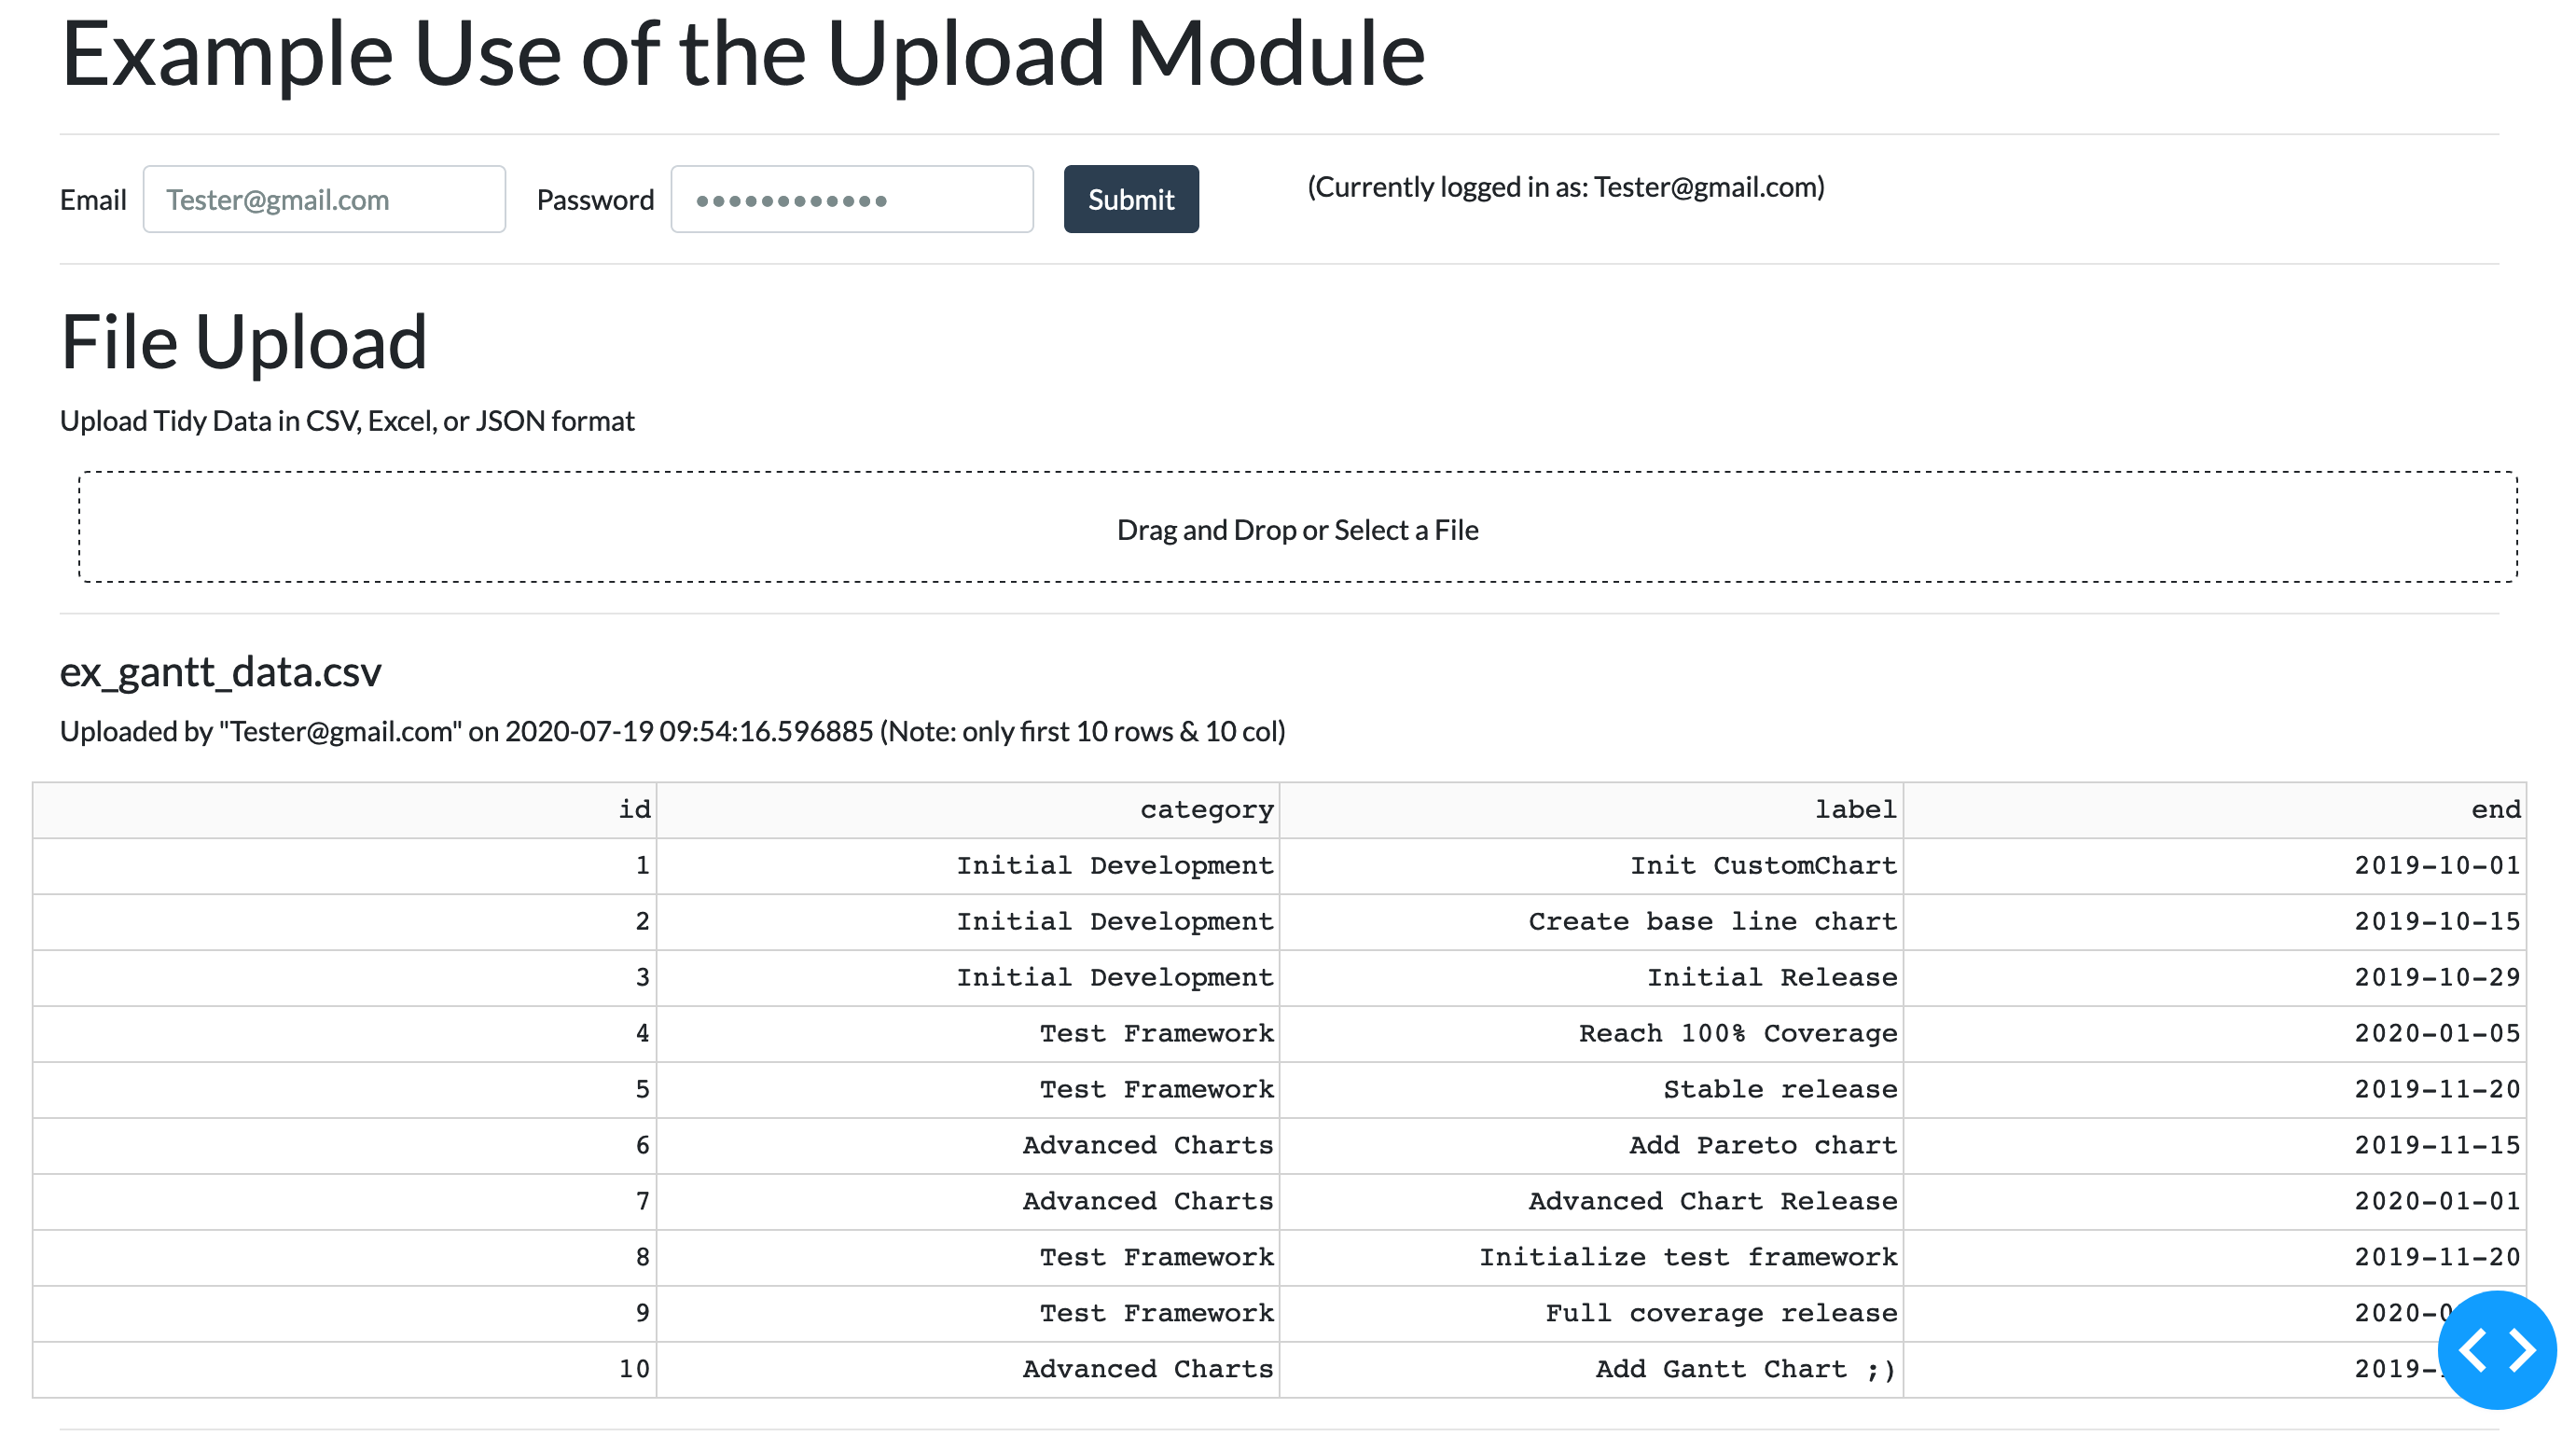
上传模块
用户选择的CSV、JSON或SQLite文件的上传模块。
请参阅示例代码 tests/examples/ex_upload.py。以下为截图
应用
每个应用程序都从AppBase()派生,这样每个标签或页面都可以独立运行或作为更复杂应用程序的一部分
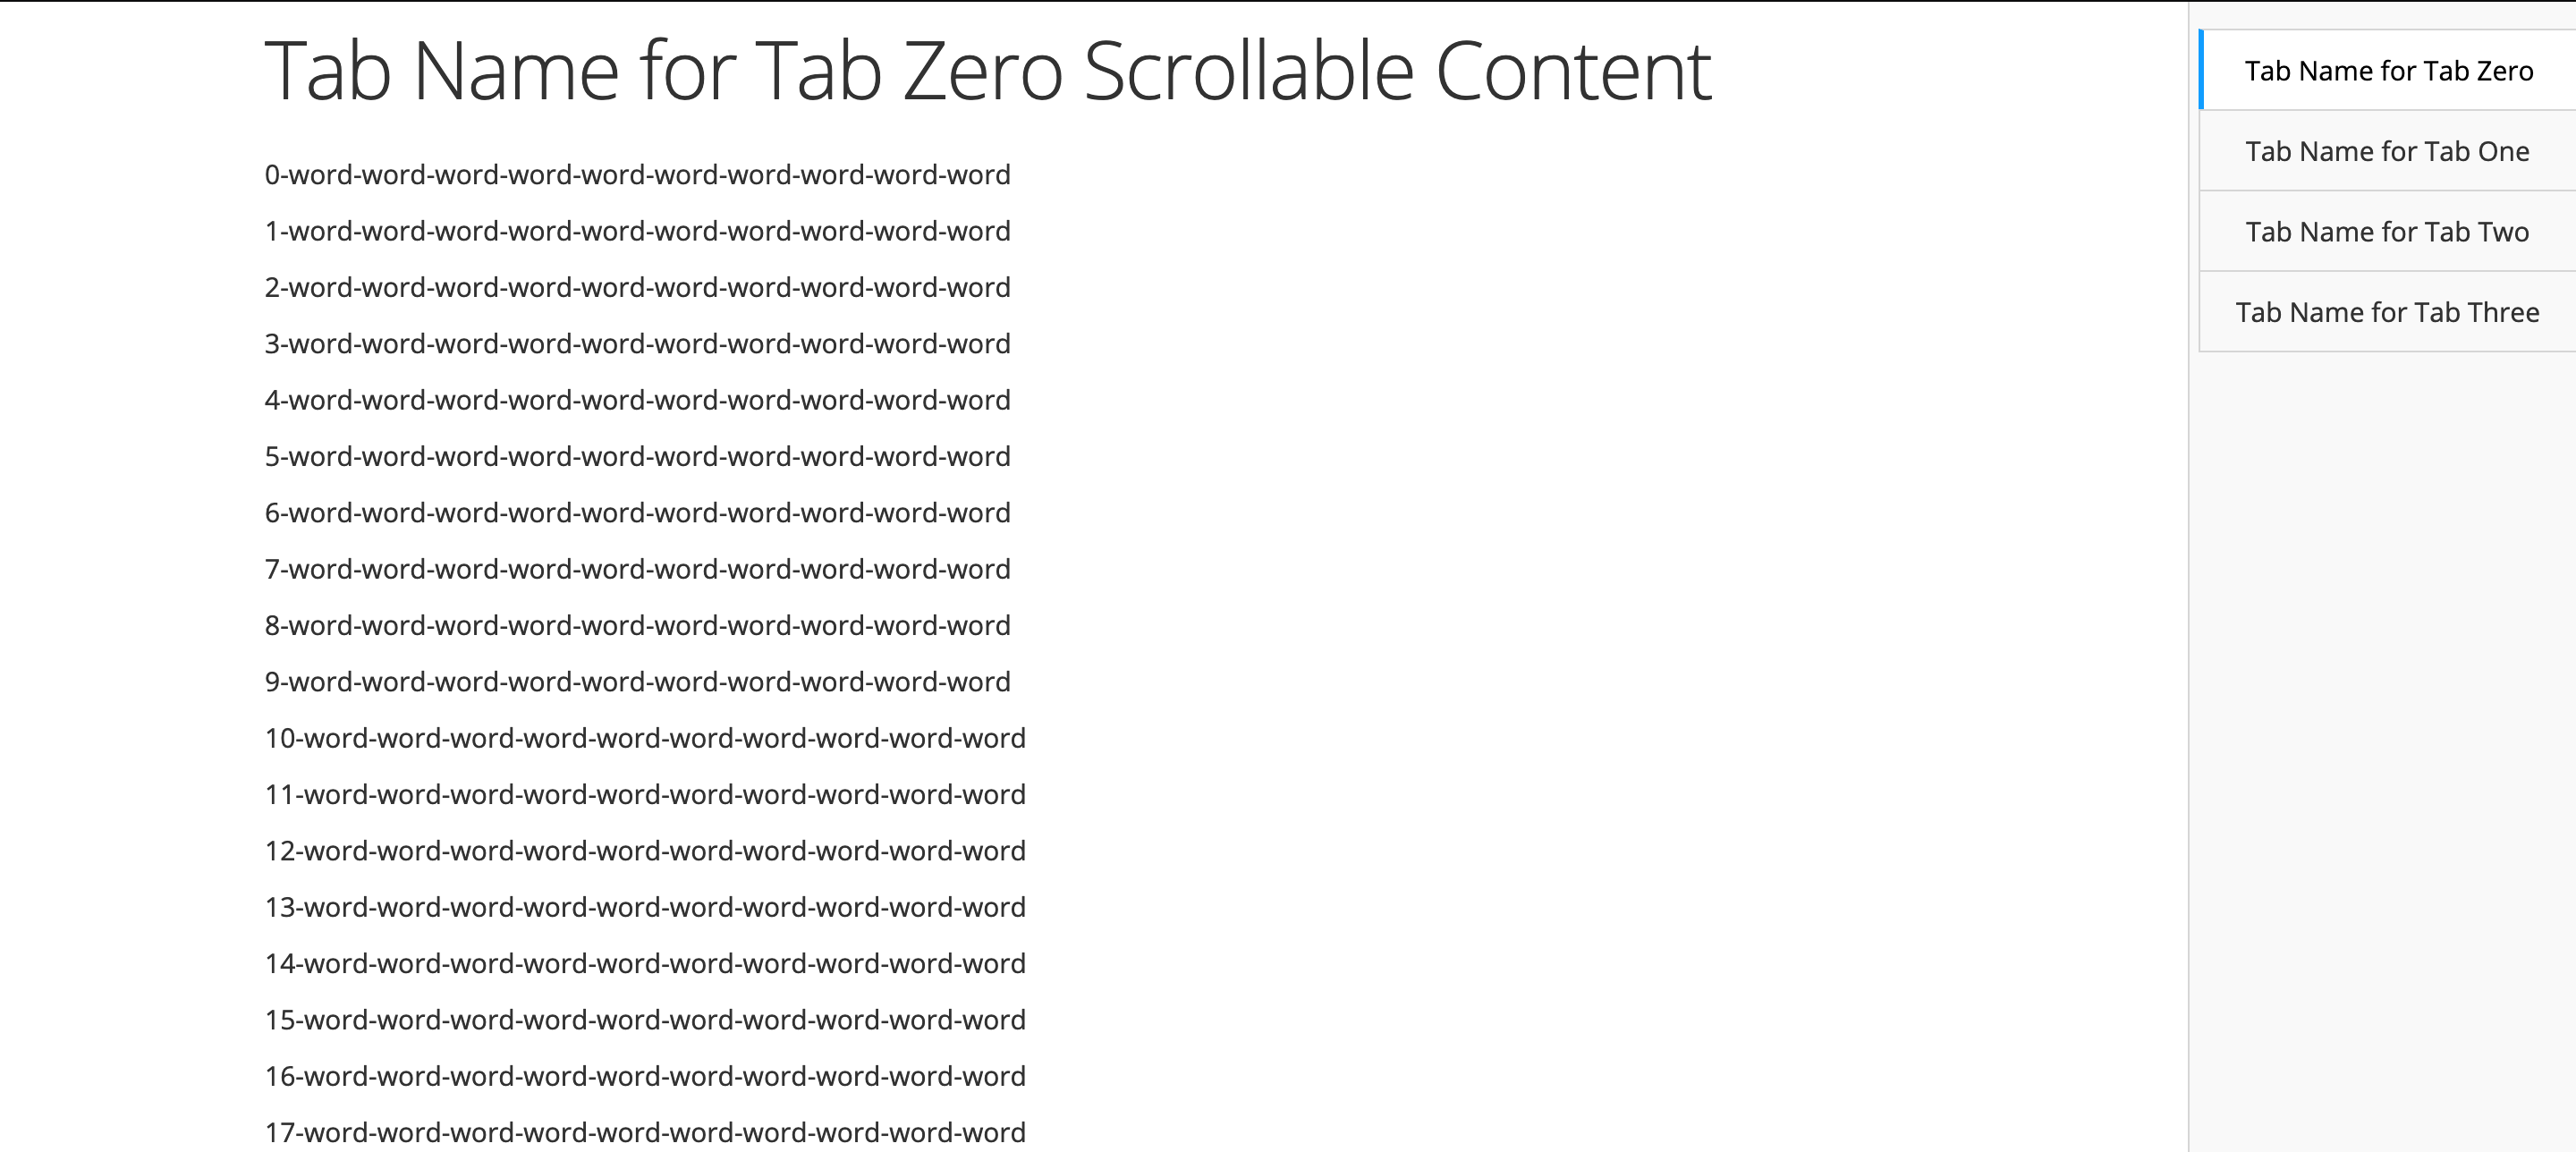
标签应用
使用AppWithTabs()基类快速构建带有标签导航的应用程序。您可以设置标签在顶部/底部/左侧/右侧,是否紧凑等。
请参阅示例代码 tests/examples/ex_tabs.py。以下为截图
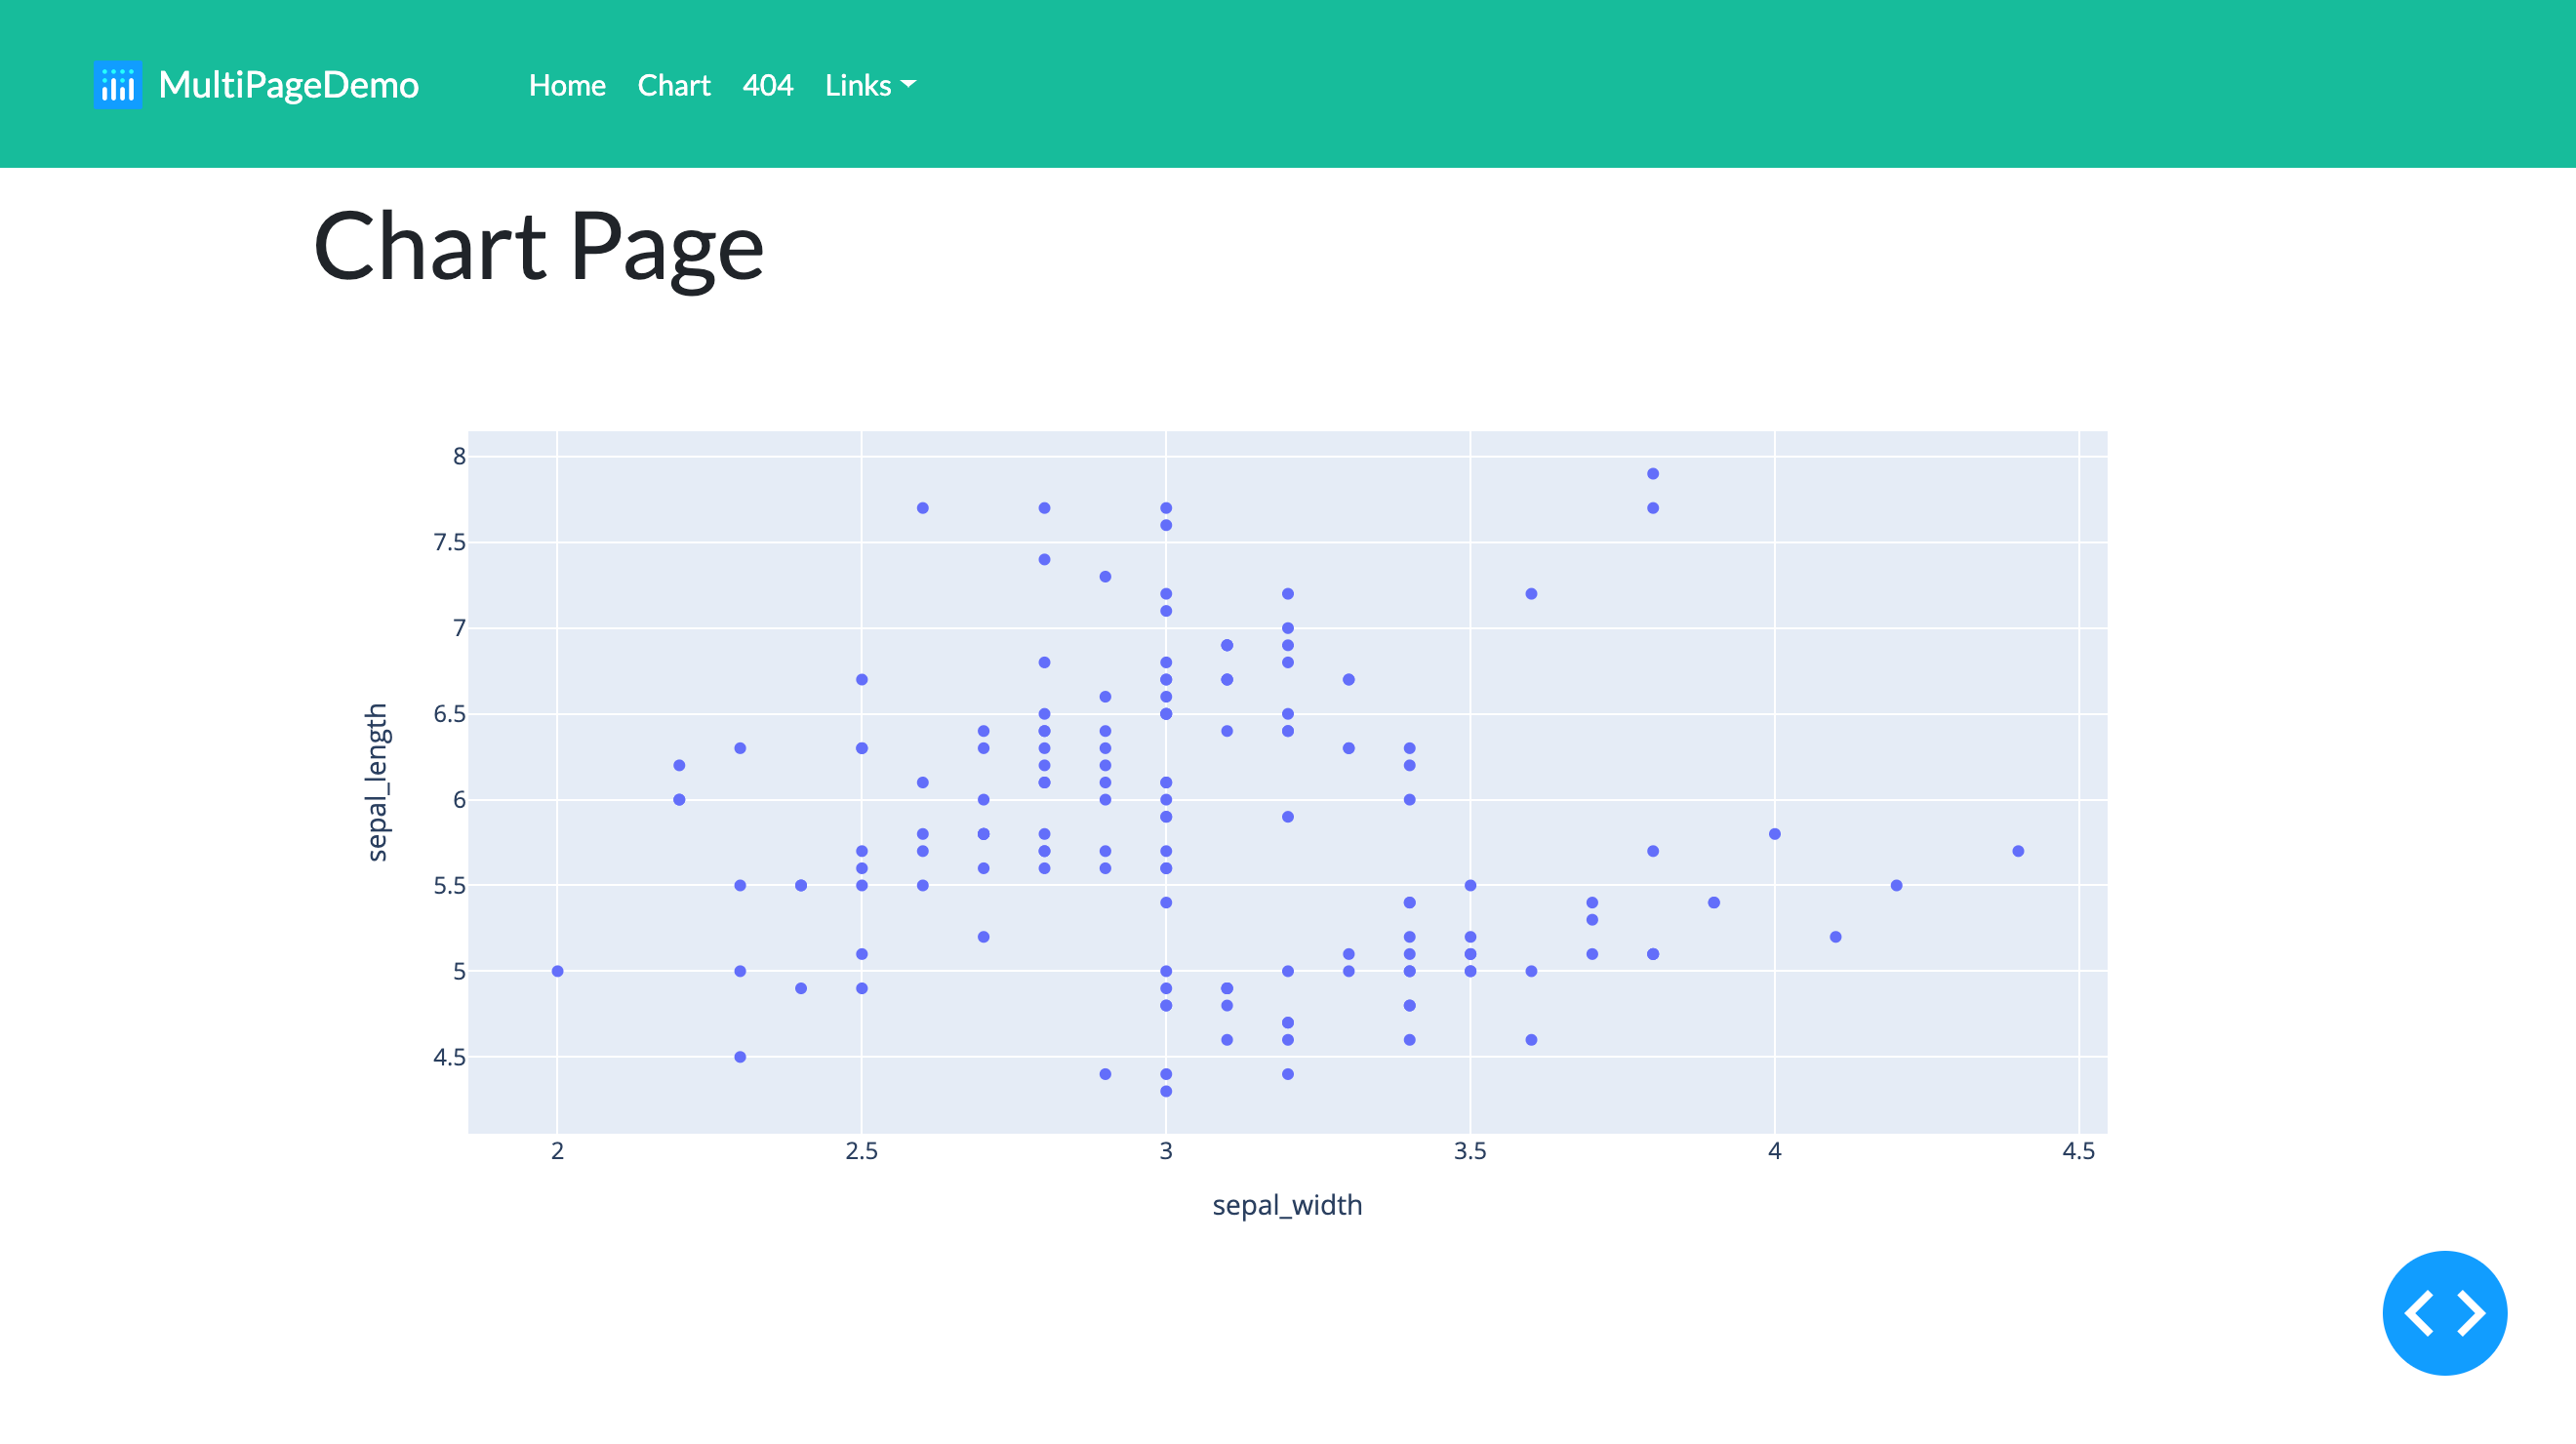
多页应用
使用AppMultiPage()基类快速构建带有标签导航的应用程序。您可以设置标签在顶部/底部/左侧/右侧,是否紧凑等。
请参阅示例代码 tests/examples/ex_multi_page.py。以下为截图
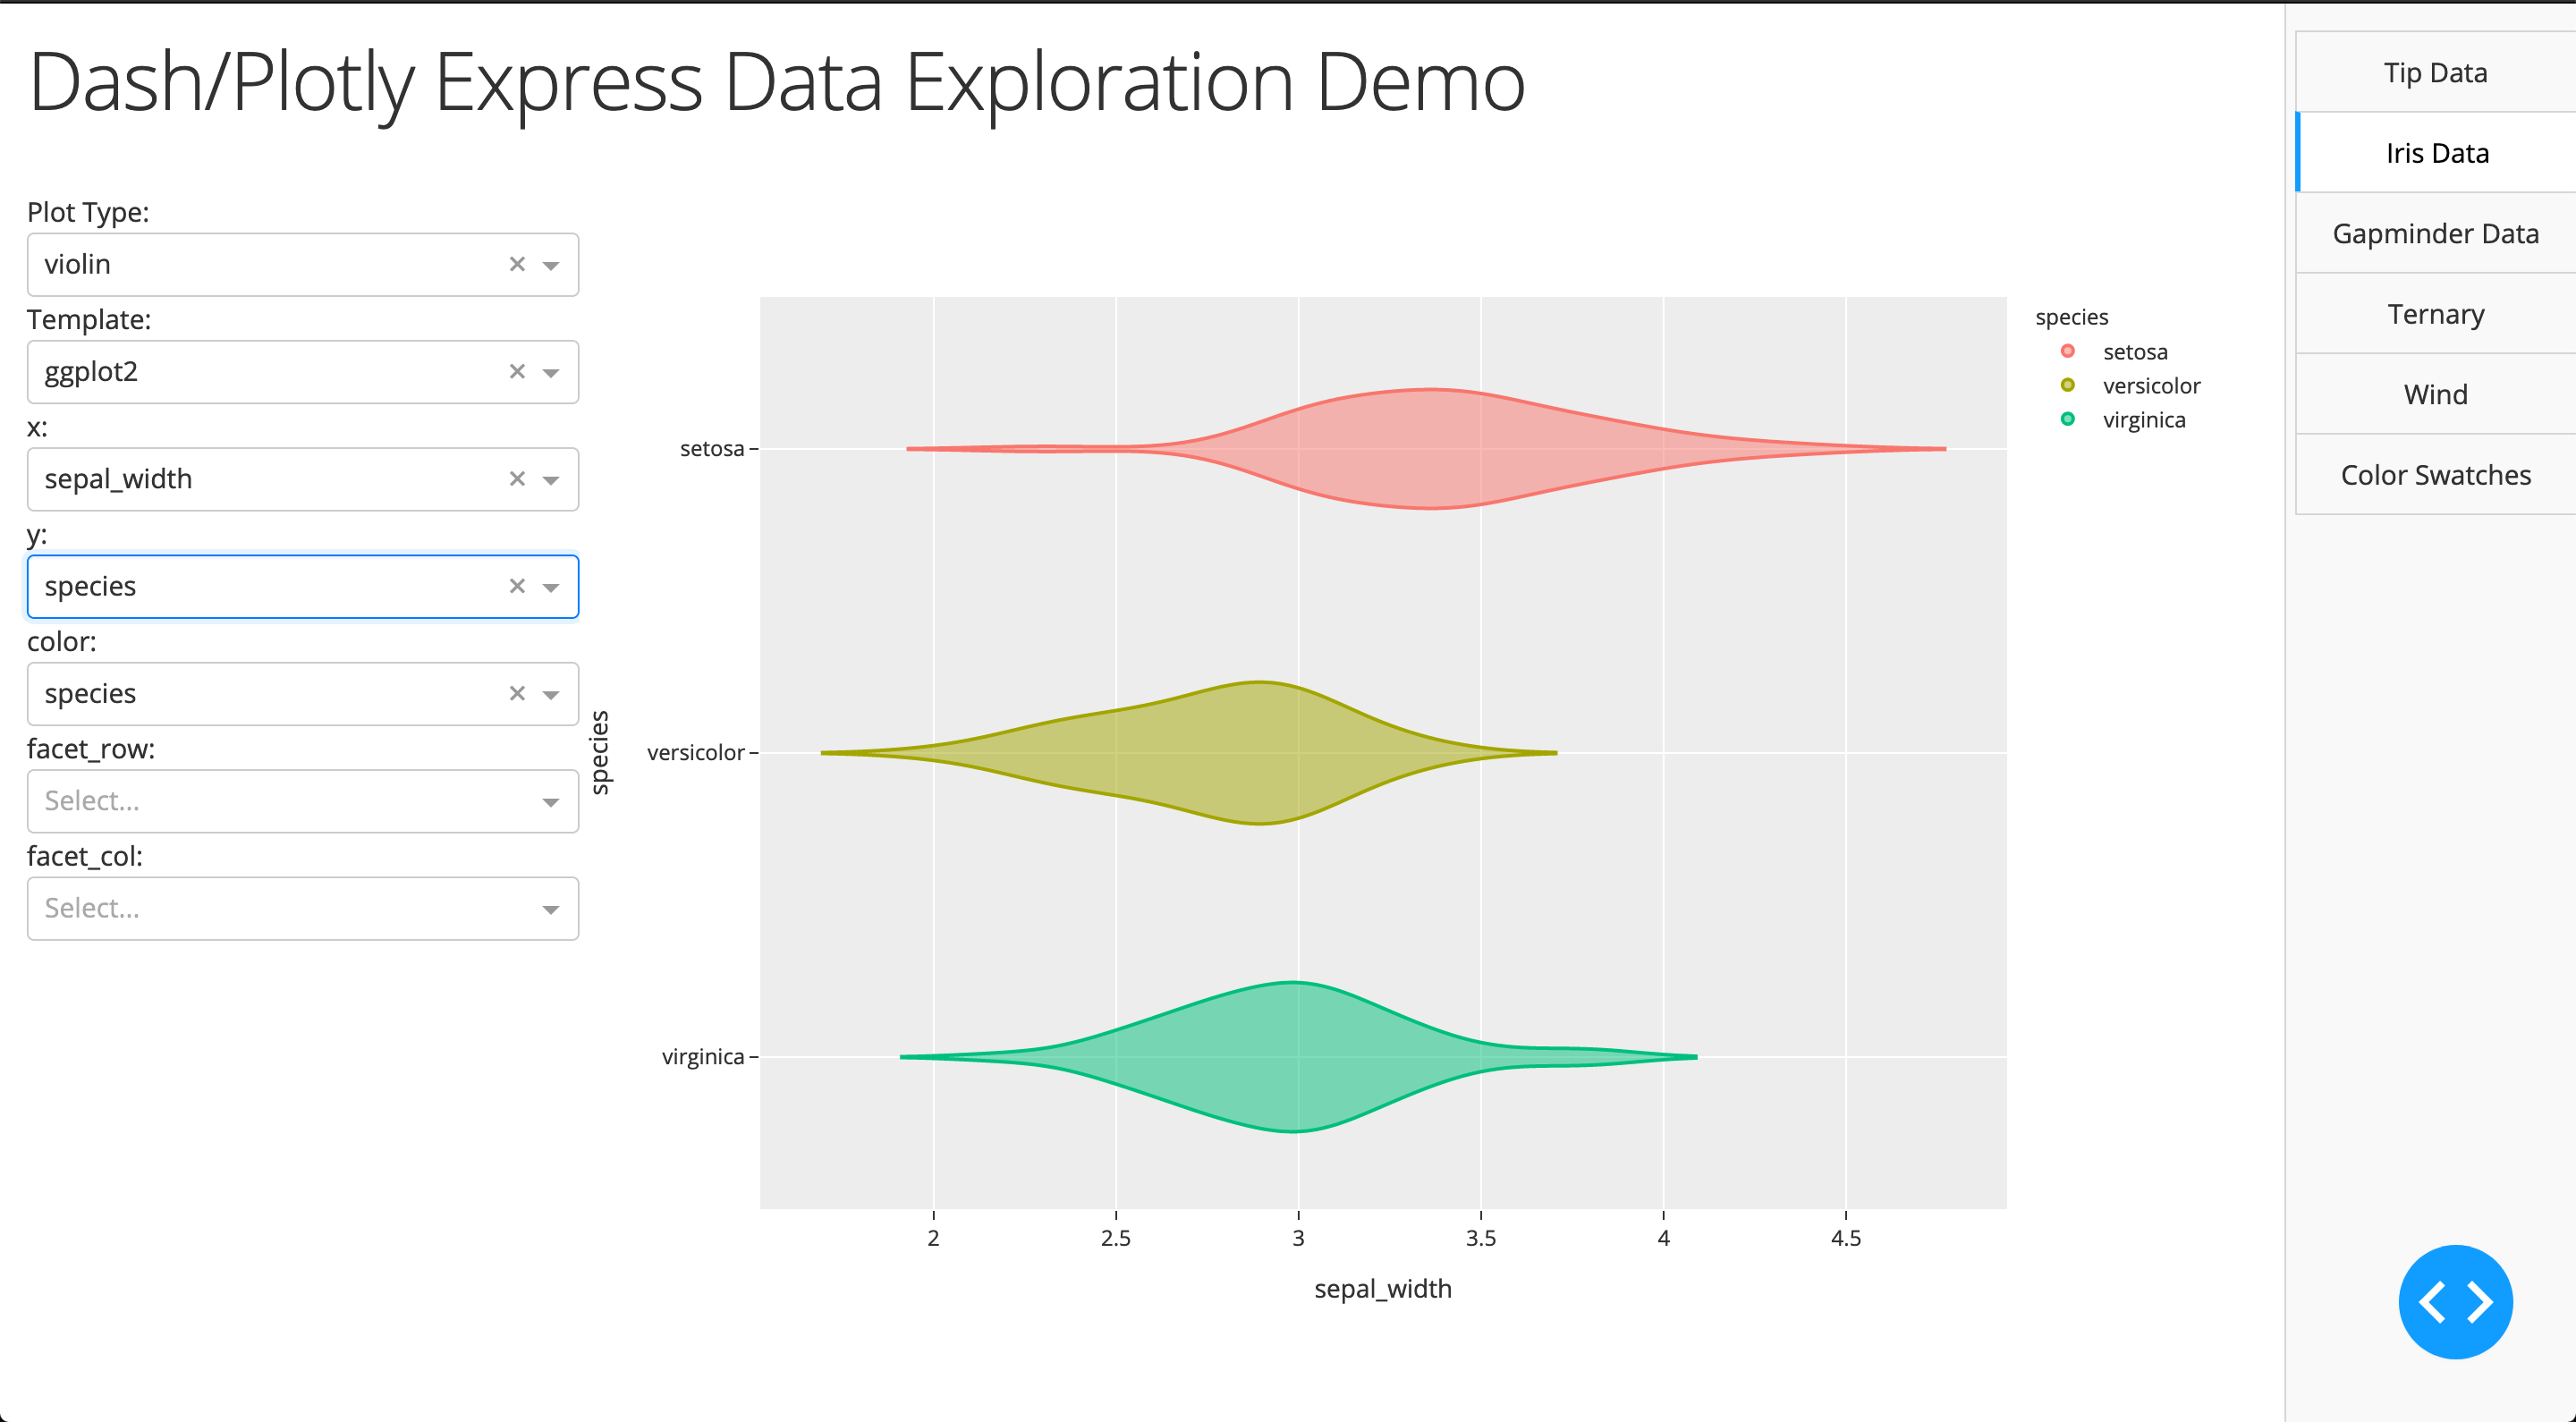
PX通用应用
为了方便从JSON、CSV或SQLite文件进行一般数据分析,dash_charts包括每种px绘图类型的应用程序和一个标签应用程序来将它们全部整合在一起。
请参阅示例代码 tests/examples/ex_app_px.py。以下为截图
其他
dash_charts中的其他一些值得注意的组件
缓存
用于利用本地缓存文件系统存储JSON数据。特别适用于抓取或对许多API调用进行缓存以本地缓存响应。
请参阅相关测试文件中的示例代码 tests/test_utils_json_cache.py
静态HTML生成
用于创建包含所有上述自定义图表或用户创建的静态HTML输出的实用程序。还包括将表格、代码、Markdown等写入到其中的实用程序。
请参阅示例代码 tests/examples/ex_utils_static.py。以下为截图

覆盖率
最新的覆盖表
| 文件 | 语句 | 缺失 | 排除 | 覆盖率 |
|---|---|---|---|---|
dash_charts/__init__.py |
2 | 0 | 0 | 100.0% |
dash_charts/app_px.py |
130 | 11 | 0 | 91.5% |
dash_charts/components.py |
13 | 0 | 0 | 100.0% |
dash_charts/coordinate_chart.py |
102 | 1 | 6 | 99.0% |
dash_charts/custom_colorscales.py |
3 | 0 | 0 | 100.0% |
dash_charts/datatable.py |
79 | 25 | 0 | 68.4% |
dash_charts/equations.py |
11 | 0 | 0 | 100.0% |
dash_charts/gantt_chart.py |
54 | 0 | 0 | 100.0% |
dash_charts/modules_datatable.py |
101 | 11 | 0 | 89.1% |
dash_charts/modules_upload.py |
132 | 60 | 0 | 54.5% |
dash_charts/pareto_chart.py |
43 | 0 | 2 | 100.0% |
dash_charts/scatter_line_charts.py |
45 | 0 | 3 | 100.0% |
dash_charts/time_vis_chart.py |
61 | 0 | 0 | 100.0% |
dash_charts/utils_app.py |
98 | 14 | 6 | 85.7% |
dash_charts/utils_app_modules.py |
26 | 3 | 4 | 88.5% |
dash_charts/utils_app_with_navigation.py |
119 | 9 | 6 | 92.4% |
dash_charts/utils_callbacks.py |
34 | 6 | 0 | 82.4% |
dash_charts/utils_data.py |
63 | 1 | 0 | 98.4% |
dash_charts/utils_dataset.py |
76 | 43 | 0 | 43.4% |
dash_charts/utils_fig.py |
77 | 2 | 4 | 97.4% |
dash_charts/utils_helpers.py |
17 | 8 | 7 | 52.9% |
dash_charts/utils_json_cache.py |
51 | 10 | 0 | 80.4% |
dash_charts/utils_static.py |
111 | 5 | 0 | 95.5% |
dash_charts/utils_static_toc.py |
22 | 1 | 0 | 95.5% |
生成日期:2020-11-08T22:46:27.420973
外部链接


有用的Dash参考链接
- 官方 Dash 文档 / Plotly 文档
- 示例应用程序
- 来自Market Ahead商业Dash应用程序的精美注释
- 来自Dash-Bio的舒适暗色应用程序,Circos
- 所有 Dash 示例应用
- 代码概念灵感
- 最佳实践
- 颜色
- 参考
安装
-
...
-
...
echo Hello World!
-
...
使用
路线图
查看 开放问题 和 里程碑 了解当前状态,以及 ./docs/CODE_TAG_SUMMARY.md 了解源代码中的注释。
有关发行历史,请参阅 ./docs/CHANGELOG.md
贡献
查看开发者指南、贡献指南等
- ./docs/DEVELOPER_GUIDE.md
- ./docs/STYLE_GUIDE.md
- ./docs/CONTRIBUTING.md
- ./docs/CODE_OF_CONDUCT.md
- ./docs/SECURITY.md
许可证


下载文件
下载适合您平台的文件。如果您不确定选择哪个,请了解更多关于 安装包 的信息。


