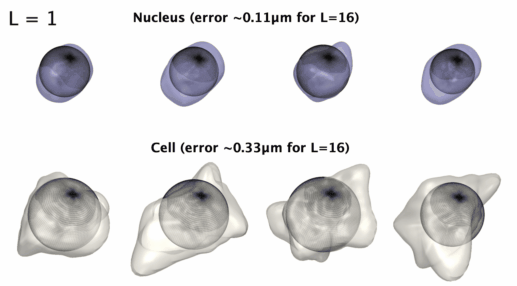
3D星形形状的球谐参数化

项目描述
AICS 球谐参数化


3D星形形状的球谐参数化。
安装
稳定版本: pip install aicsshparam
从源码构建以进行定制:
git clone git@github.com:AllenCell/aics-shparam.git
cd aics-shparam
pip install -e .
如何使用
在此,我们概述了如何将球谐系数作为形状描述符在由三种不同形状(球体、立方体和八面体)组成的合成数据集上使用的一个示例。
# Import required packages
import numpy as np
import pandas as pd
import matplotlib.pyplot as plt
from sklearn.decomposition import PCA
from aicsshparam import shtools, shparam
from skimage.morphology import ball, cube, octahedron
np.random.seed(42) # for reproducibility
# Function that returns binary images containing one of the three
# shapes: cubes, spheres octahedrons of random sizes.
def get_random_3d_shape():
idx = np.random.choice([0, 1, 2], 1)[0]
element = [ball, cube, octahedron][idx]
label = ['ball', 'cube', 'octahedron'][idx]
img = element(10 + int(10 * np.random.rand()))
img = np.pad(img, ((1, 1), (1, 1), (1, 1)))
img = img.reshape(1, *img.shape)
# Rotate shapes to increase dataset variability.
img = shtools.rotate_image_2d(
image=img,
angle=360 * np.random.rand()
).squeeze()
return label, img
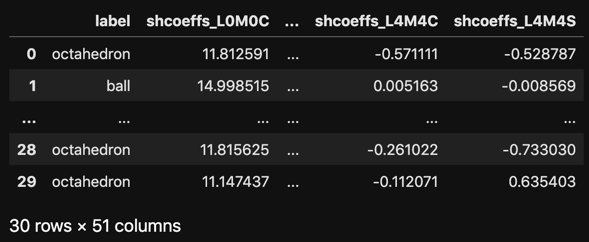
# Compute spherical harmonics coefficients of shape and store them
# in a pandas dataframe.
df_coeffs = []
for i in range(30):
# Get a random shape
label, img = get_random_3d_shape()
# Parameterize with L=4, which corresponds to50 coefficients
# in total
(coeffs, _), _ = shparam.get_shcoeffs(image=img, lmax=4)
coeffs.update({'label': label})
df_coeffs.append(coeffs)
df_coeffs = pd.DataFrame(df_coeffs)
# Vizualize the resulting dataframe
with pd.option_context('display.max_rows', 5, 'display.max_columns', 5):
display(df_coeffs)
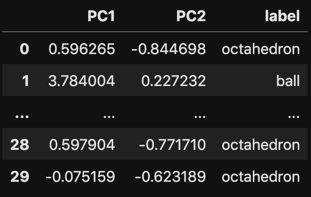
# Let's use PCA to reduce the dimensionality of the coefficients
# dataframe from 51 down to 2.
pca = PCA(n_components=2)
trans = pca.fit_transform(df_coeffs.drop(columns=['label']))
df_trans = pd.DataFrame(trans)
df_trans.columns = ['PC1', 'PC2']
df_trans['label'] = df_coeffs.label

# Vizualize the resulting dataframe
with pd.option_context('display.max_rows', 5, 'display.max_columns', 5):
    display(df_trans)
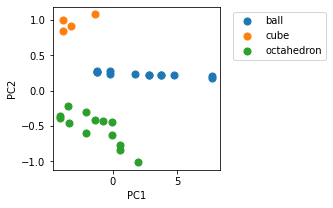
# Scatter plot to show how similar shapes are grouped together.
fig, ax = plt.subplots(1,1, figsize=(3,3))
for label, df_label in df_trans.groupby('label'):
    ax.scatter(df_label.PC1, df_label.PC2, label=label, s=50)
plt.legend(loc='upper left', bbox_to_anchor=(1.05, 1))
plt.xlabel('PC1')
plt.ylabel('PC2')
plt.show()
参考
有关如何在艾伦细胞研究所使用此包分析超过200k个单细胞图像数据集的示例,请参阅我们在bioaRxiv上的论文。
开发
有关开发代码的相关信息,请参阅CONTRIBUTING.md。
有问题?
如果您有任何问题,请在我们艾伦细胞论坛上留下评论: https://forum.allencell.org/。
免费软件:艾伦研究所软件许可证


下载文件
下载适合您平台文件的文件。如果您不确定该选择哪个,请了解有关安装包的更多信息。
源分发
aicsshparam-0.1.10.tar.gz (670.3 kB 查看哈希值)
构建分发
aicsshparam-0.1.10-py2.py3-none-any.whl (14.7 kB 查看哈希值)
关闭
aicsshparam-0.1.10.tar.gz的哈希值
| 算法 | 哈希摘要 | |
|---|---|---|
| SHA256 | 89b3a9732dd87631e23e239262d96496b500b22b2f7ed4ba165dd22927129a3b |
|
| MD5 | ebcd28d78aafe515fc5e6c6c97589fb5 |
|
| BLAKE2b-256 | cb172cb2cb7b636db144d025ba01933c007e2271e73f41c01e896d5b2170a8c7 |
关闭
aicsshparam-0.1.10-py2.py3-none-any.whl的哈希值
| 算法 | 哈希摘要 | |
|---|---|---|
| SHA256 | 75f8c9f484cb667f78f1f049f28cf3189ab7f6e6edd241232c343b8a42462867 |
|
| MD5 | 6c4e92c2bb9c221f2470db45197d7ed4 |
|
| BLAKE2b-256 | 311b3b8d18855df79ea4f7f6512917b28e9f59f25ec6d0421491d04753bcb0d8 |


